How to Find Your Production Bottleneck
Starved vs Blocked
The slowest machine on your line is rarely the constraint that's costing you throughput. A stopped machine is either starved or blocked, and those two states point in opposite directions. Here's how to read them, find the machine that sets your output, and prove the fix before you spend a dollar on it.
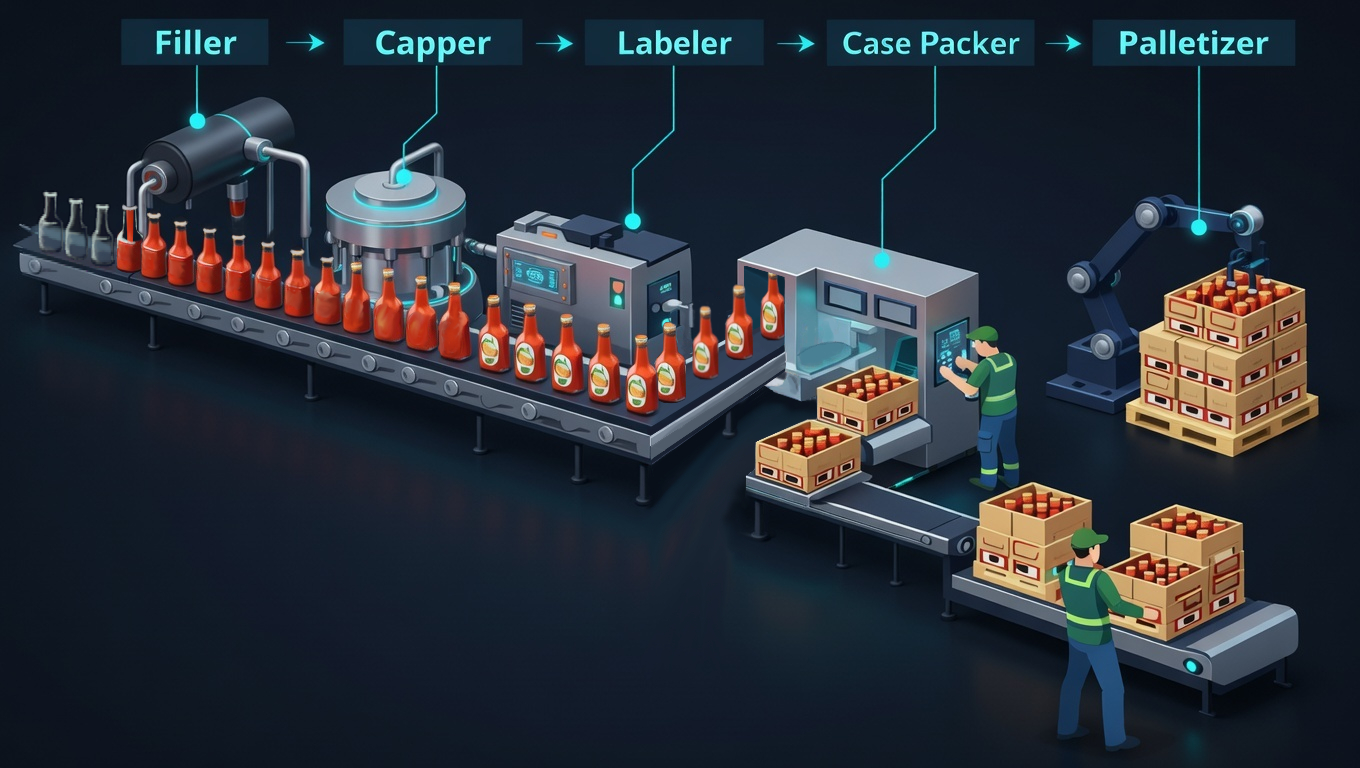
Walk any plant floor and people will point you to "the bottleneck": the machine with the pile of work in front of it, or the one with the slowest cycle time on the spec sheet. Sometimes they're right, but usually they're not. The station with the biggest pile is often just downstream of the real problem, and the slowest rated machine often isn't the slowest effective one once you account for how often it stops.
Find the true constraint and you can make a much smaller fix where the line is actually losing time. Miss it and you pay for a faster machine that doesn't move throughput at all.
The bottleneck you can see vs. the one that's costing you
A production line is a chain of dependent stations with variability at every one. Because the stations are coupled, a problem at one shows up as a symptom at another. Here's the classic trap.
- WIP piles up in front of Station B, so everyone "knows" B is the bottleneck.
- But B is piling up because Station C downstream keeps micro-stopping. B is blocked, not slow.
- Speed up B and nothing changes. The constraint was C all along.
The pile of WIP tells you where flow is interrupted, not where the cause lives. To find the cause, you have to look at starvation and blocking, two things the WIP pile won't show you.
Starved vs blocked: same symptom, opposite cause
From the aisle, both look like a machine sitting still. Which way to walk to find the cause depends on which of two states it’s in.
- Starved means the machine has nothing to work on. It’s ready to run, but no material is arriving. The cause is upstream.
- Blocked means the machine has finished a unit and has nowhere to put it. It’s ready to run, but the exit is full. The cause is downstream.
Send a technician the wrong way and they’ll spend twenty minutes inspecting a perfectly healthy machine.
The buffer tells you which one it is
You don’t need instrumentation to tell them apart. Look at the storage on either side of the stopped machine.
Reading the line
| What you see | State | Where the cause is |
|---|---|---|
| Buffer feeding it is empty | Starved | upstream (something isn’t delivering) |
| Buffer after it is full | Blocked | downstream (something isn’t accepting) |
| Both have material and it still isn’t running | Down | this machine, so now you can look at it |
Only the third case justifies inspecting the machine in front of you. In the first two, the equipment is healthy and waiting. A buffer that’s chronically full or empty says the same thing about the line as a whole, with the constraint downstream of a full one and upstream of an empty one.
The same check finds the bottleneck. The true constraint on a line is the machine that’s neither starved nor blocked, the one still running while everything around it waits. Everyone watches the stopped machines, so bottlenecks get misidentified again and again.
Measure the time split, not one moment
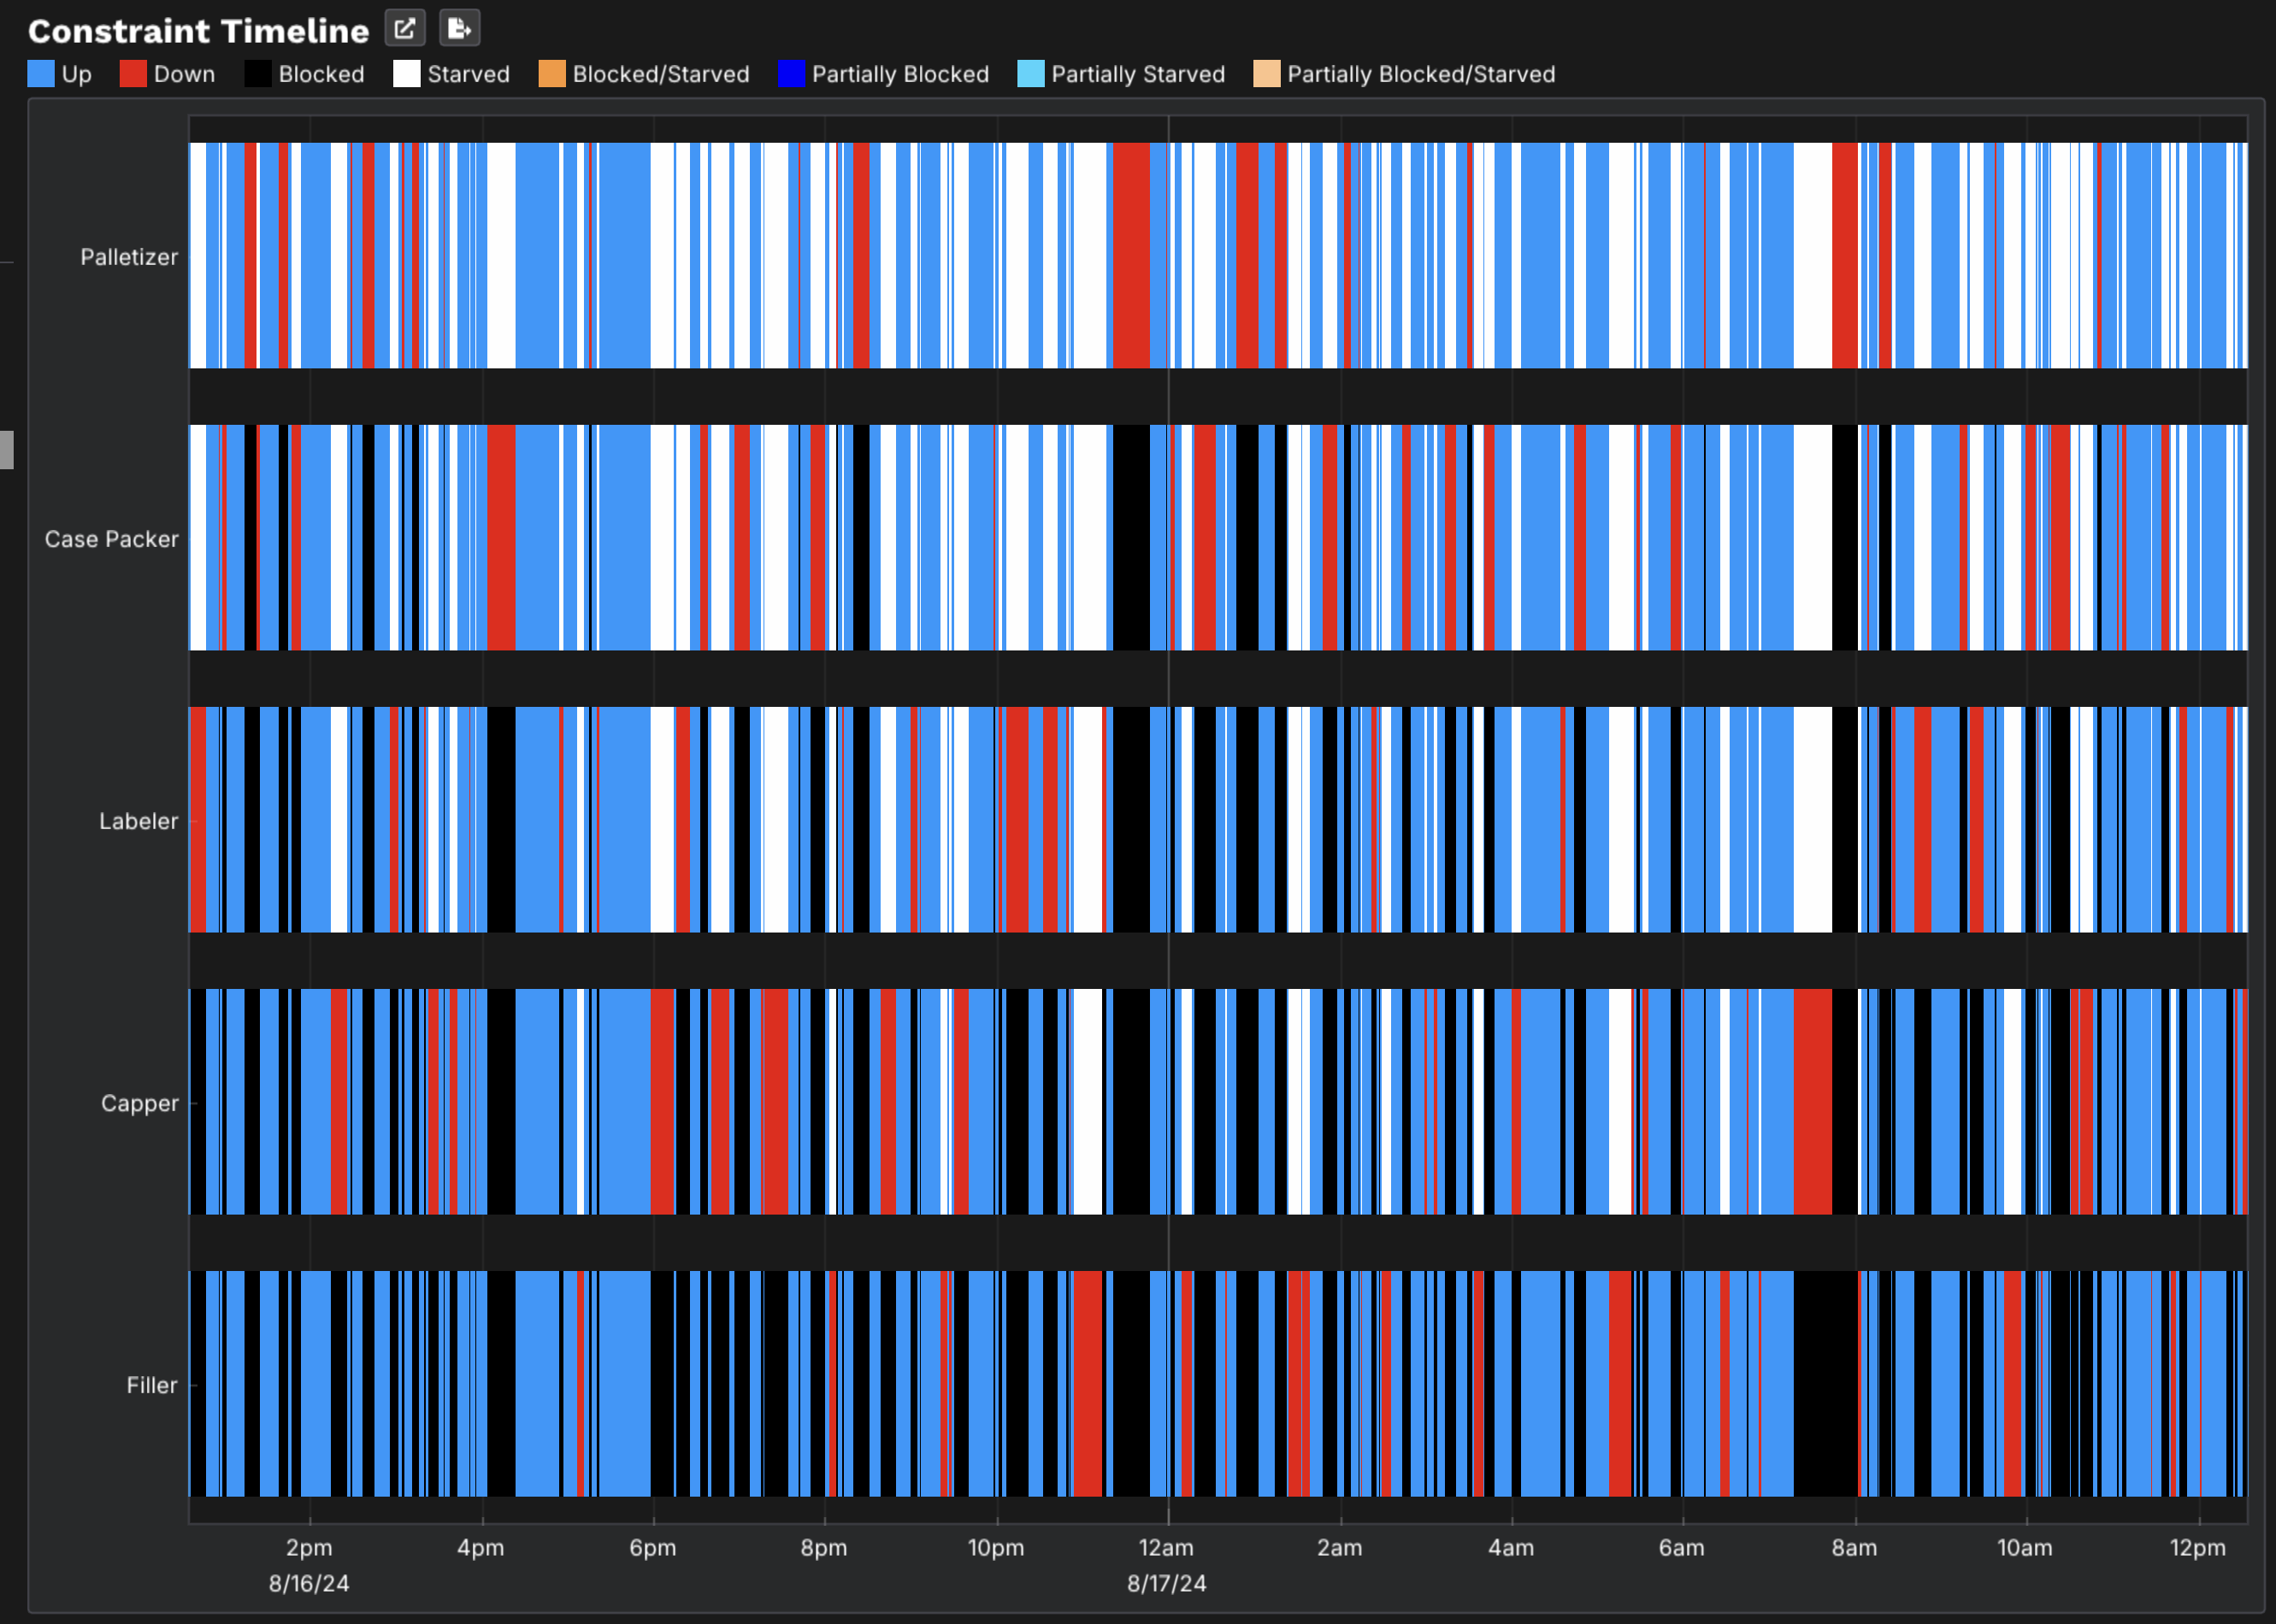
On a real line these states blur. A machine flickers between starved, blocked and running many times an hour, and a supervisor walking past captures one instant of it. What you need is the proportion of time each machine spent in each state across a full run. The constraint is the station with the highest running time and the lowest starved-plus-blocked time. No amount of floor observation gives you that reliably.
Because buffers and constraints interact directly, a rate-based model produces blocking and starvation on its own, with no rules to write or logic to configure. Set the rates, the capacities and the interrupts, and the states come out of the flow. You get back the time split per machine, so an argument about who’s holding up the line becomes a reading.
The split also shows where capacity is wasted. If a machine is mostly blocked, adding capacity there would produce nothing, because it’s already making more than the next step can take.
One day of the line, event by event
The replay steps through a completed run and shows the state of every node as the flow moves: capacity, volume, fill percentage, inlet and outlet rate, and whether the node is up. The strip underneath is the constraint timeline for the same window, so you can scrub to any moment and read what each machine was doing.
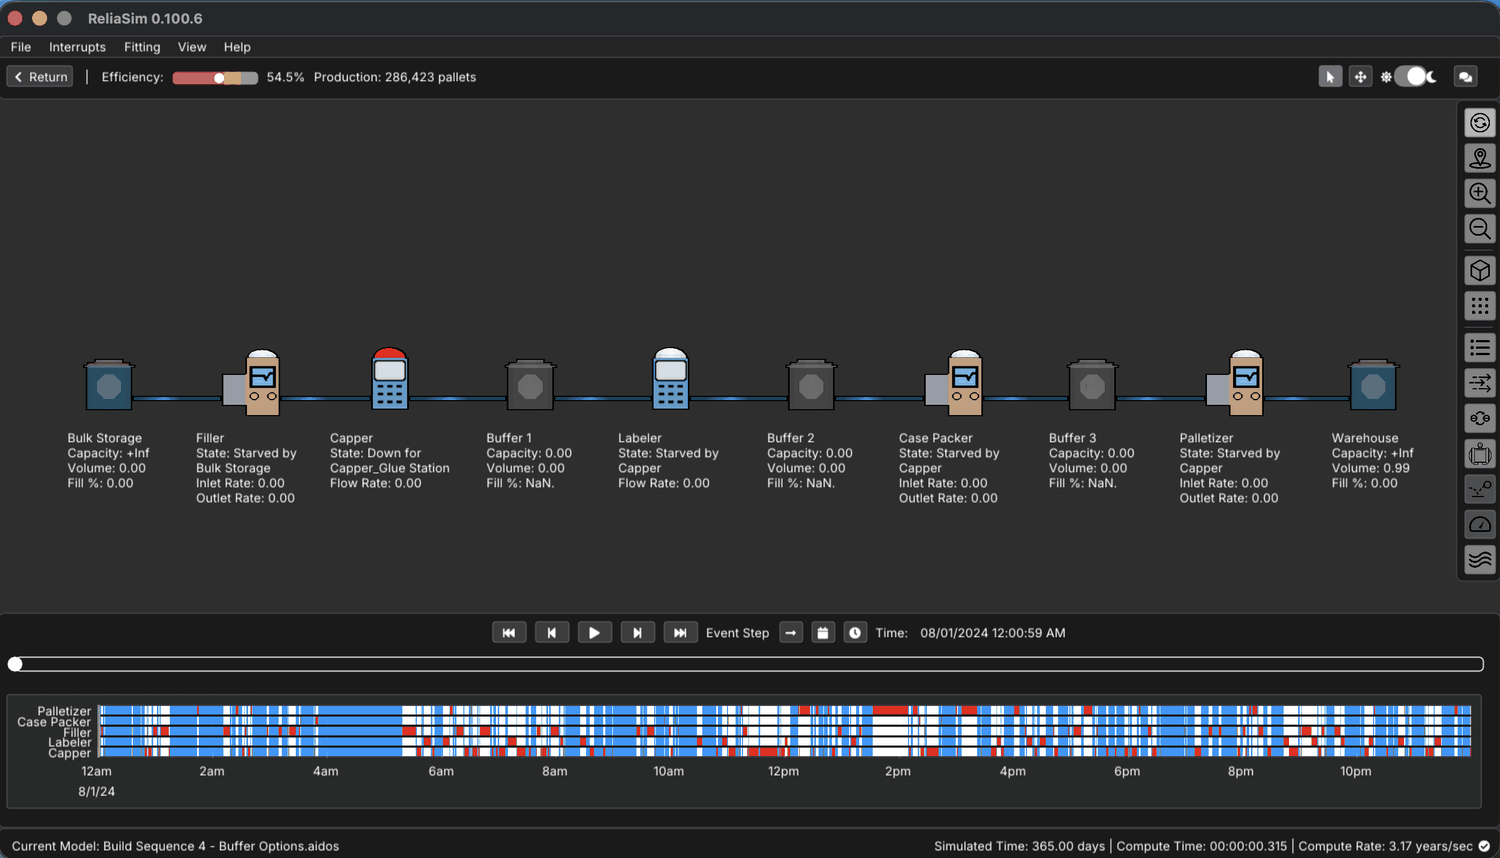
Capper_Glue Station. Read along the line from there. The Labeler, the Case Packer and
the Palletizer each report Starved by Capper, and every buffer between them shows
Volume: 0.00. So one stoppage leaves three downstream machines idle, each attributed to the machine that caused it.
The Filler upstream is idle too, but the model gives it a different cause, Starved by Bulk Storage.Effective rate, not rated rate
A machine rated at 60 units/min that goes down for a 90-second jam every 12 minutes isn't a 60/min machine. Its effective rate is far lower, and the variability of those stops ripples downstream. The bottleneck is set by effective throughput under real failure behavior. Two lines with identical nameplate capacity can have very different output for that reason.
When the bottleneck moves with the product
A coffee plant ran a Make-Store-Pack layout. Making ran into intermediate storage, and packing lines drew from it into finished formats. A quality initiative added a new stage to that chain, and scheduling broke. Nothing had failed. Each packaging size draws from the store at a different rate, so every format change moved the bottleneck. The plant’s Advanced Planning System assumed a fixed constraint, and its schedules slipped whenever the mix changed.
The team’s discrete-rate model reproduced the moving bottleneck instead of assuming it away. With it they designed and tested a new scheduling algorithm, and checked it across a range of demand scenarios before it went into use. If your constraint seems to change with the product mix, it probably does, and a schedule built around one fixed constraint won’t hold.
From a ChiAha project record, reported without a throughput or cost figure; client not named.
Why averages hide the bottleneck
Spreadsheets trip up here. If you model each station at its average rate, the line looks balanced and the math says you're fine. Real lines don't run on averages. They run on distributions, and the way variability interacts across coupled stations destroys throughput in ways an average-based calculation can't represent.
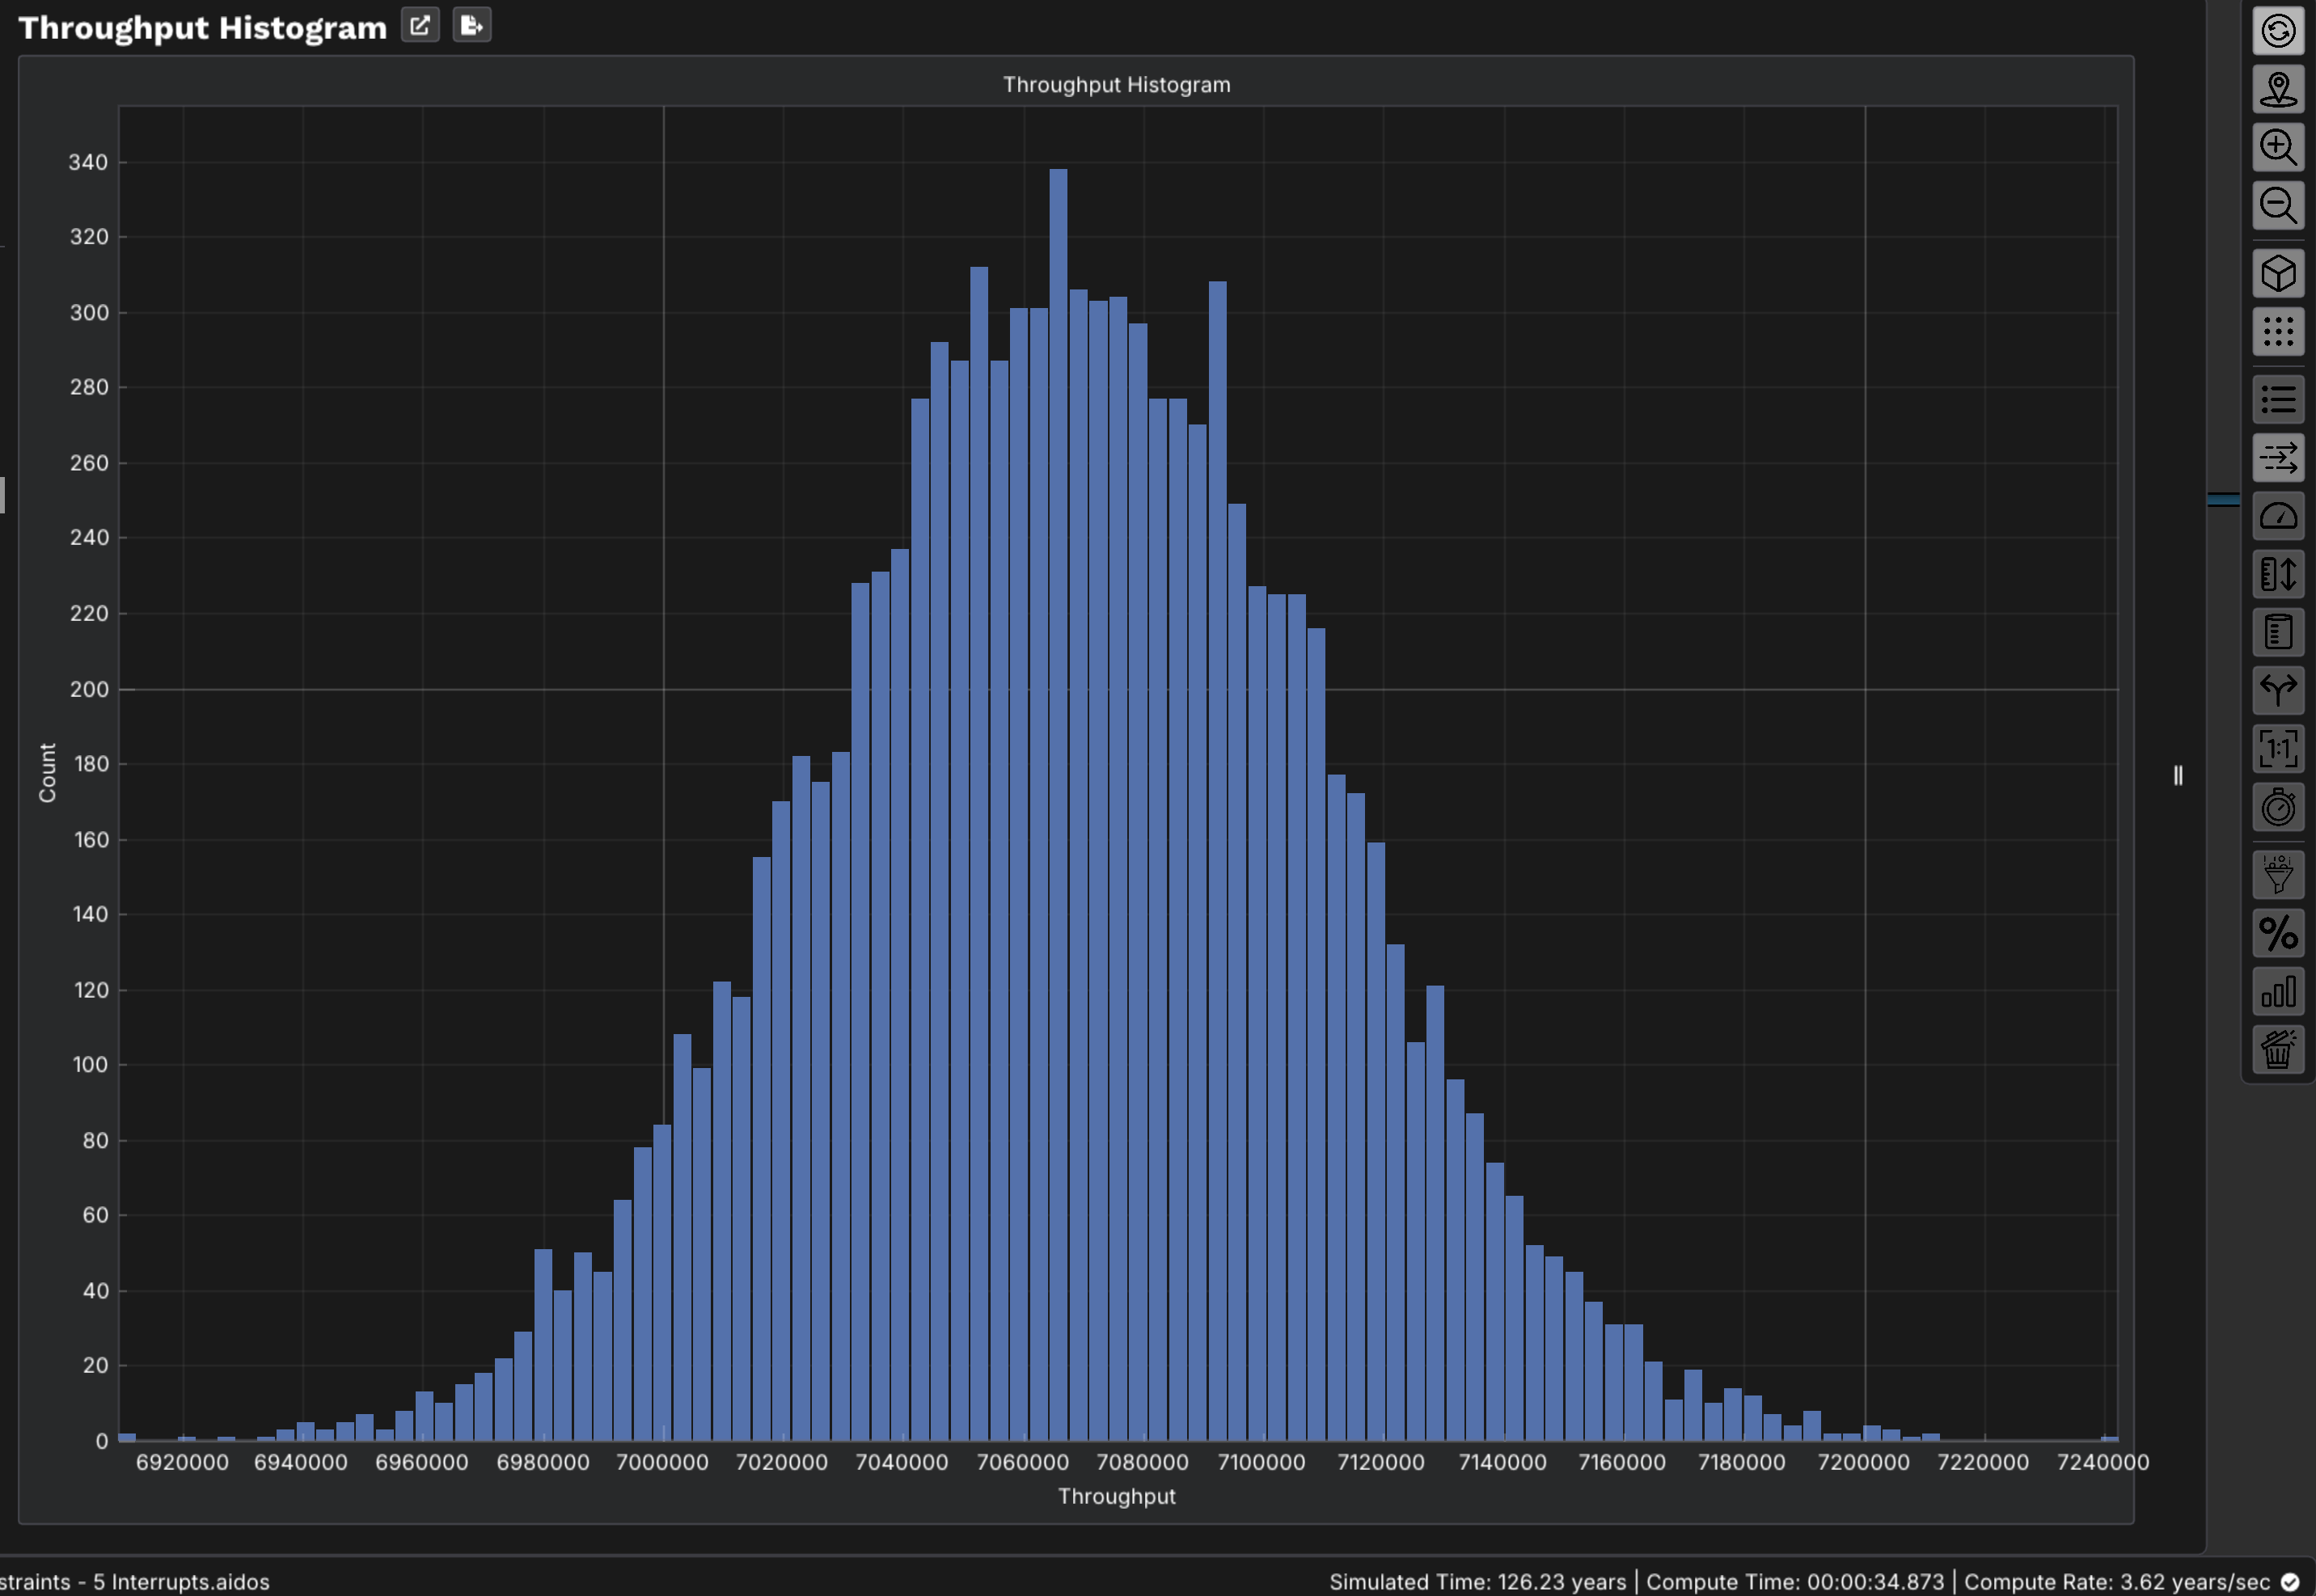
A real example. On one packaging line, the labeler and the filler had nearly identical average rates, so on paper the line was perfectly balanced. But the labeler had frequent, short micro-stops, and each one briefly blocked the filler upstream. Each stop was trivial on its own. Added up, those cascading micro-stops were costing real throughput, even though on average nothing was wrong.
To find loss that lives in variability and coupling, you need a model that plays the line forward through time, with each station's real failure behavior, and watches where flow actually breaks.
How to prove it before you spend
Once you suspect a constraint, the expensive mistake is to act on the suspicion. The better move is to simulate the line. Build a model where each station carries its real cycle time and its real interrupt behavior (how often it fails and how long it's down). Run it forward and read the starvation/blocking and effective-throughput signals directly. Then test the fix in the model. Add the buffer, speed up the suspected station or change the maintenance interval, and see whether throughput moves.
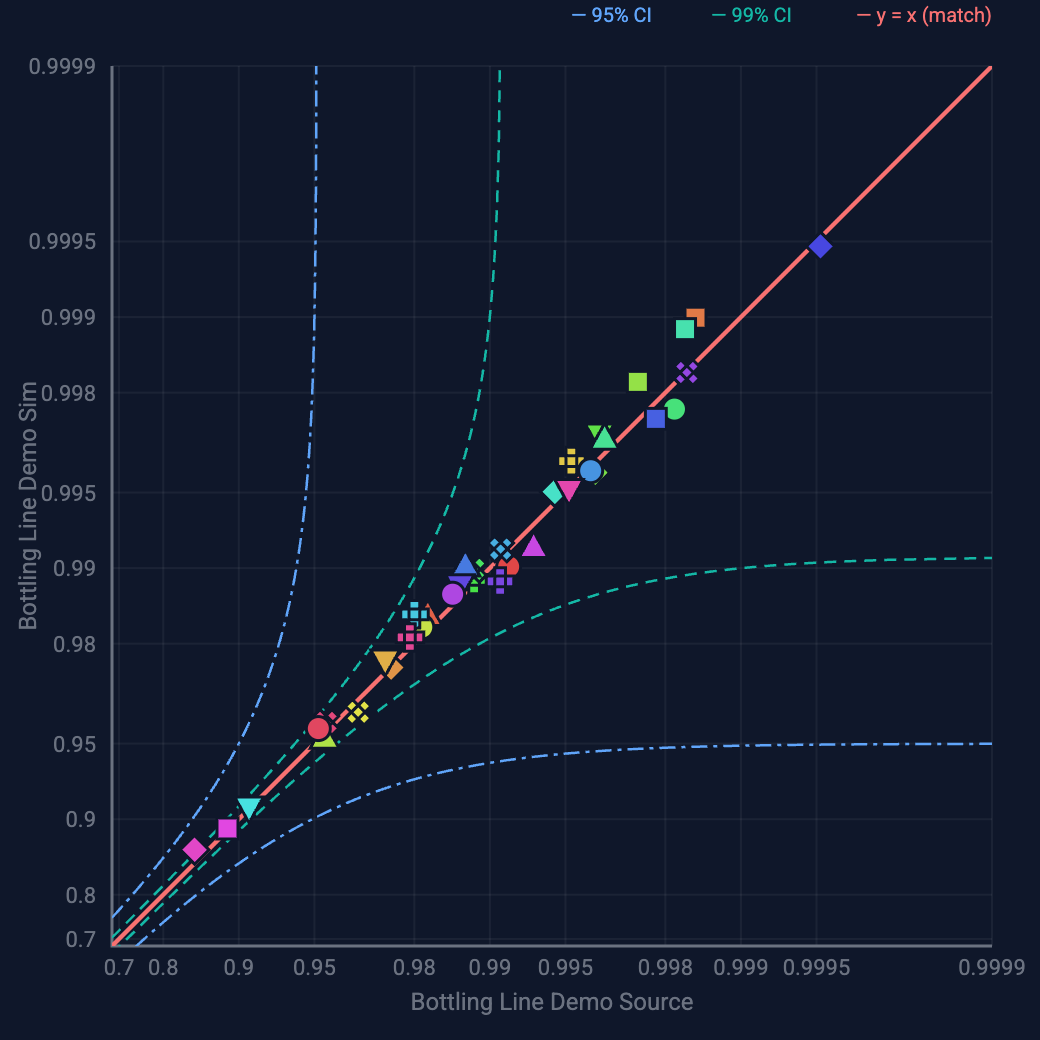
A simulation is only worth acting on if it matches reality, and a model whose numbers nobody validated is just a more elaborate guess. The standard to hold it to is a model validated against your actual production data, close enough that you'd bet a capital decision on it. The published benchmark is within 1% of measured OEE.
The short version
- The biggest WIP pile shows you where flow breaks, not why.
- A starved machine points upstream and a blocked one points downstream. The constraint is the machine that’s neither.
- Use effective rate under real failure behavior, never nameplate rate.
- Validate the model against real data before you act on it.
Try it on a real bottling line: the Sandbox question What should we fix first?, or one move in Beat the Bottleneck.
Start free in the browser
The ReliaSim® Sandbox has curated production-line models in your browser, with no signup. Each one shows every machine's availability from a saved engine run, and you can ask it where the bottleneck is and why. When you're ready to model your own line, that's the full version.
Open the sandbox → See pricingWant to see it on a real line first? Read the case study or schedule a call.