The line
A high-speed bottling line with five machines: Filler, Capper, Labeler, Case Packer, and Palletizer. Running 90-day production cycles at a nominal rate of 60 bottles per minute per machine. Historian data available for all machines.
The production team tracked OEE at 53.6% — but their Loss Tree pointed them at the wrong fix.
The problem
Two failure modes appeared nearly equal in the Loss Tree:
Labeler Misalignment
Infrequent, longer stops. The Loss Tree says: fix this first.
Filler Micro Stop
Frequent, short stops. The Loss Tree says: similar priority.
Similar direct losses. Your Pareto ranks them equally. Most CI teams would fix the Labeler first — it's the bigger single event.
The simulation
ReliaSim modeled the full line with validated interrupt distributions from ReliaStats. The model matched the historian to within 1% OEE. Then each failure mode was eliminated individually and the whole system was re-simulated.
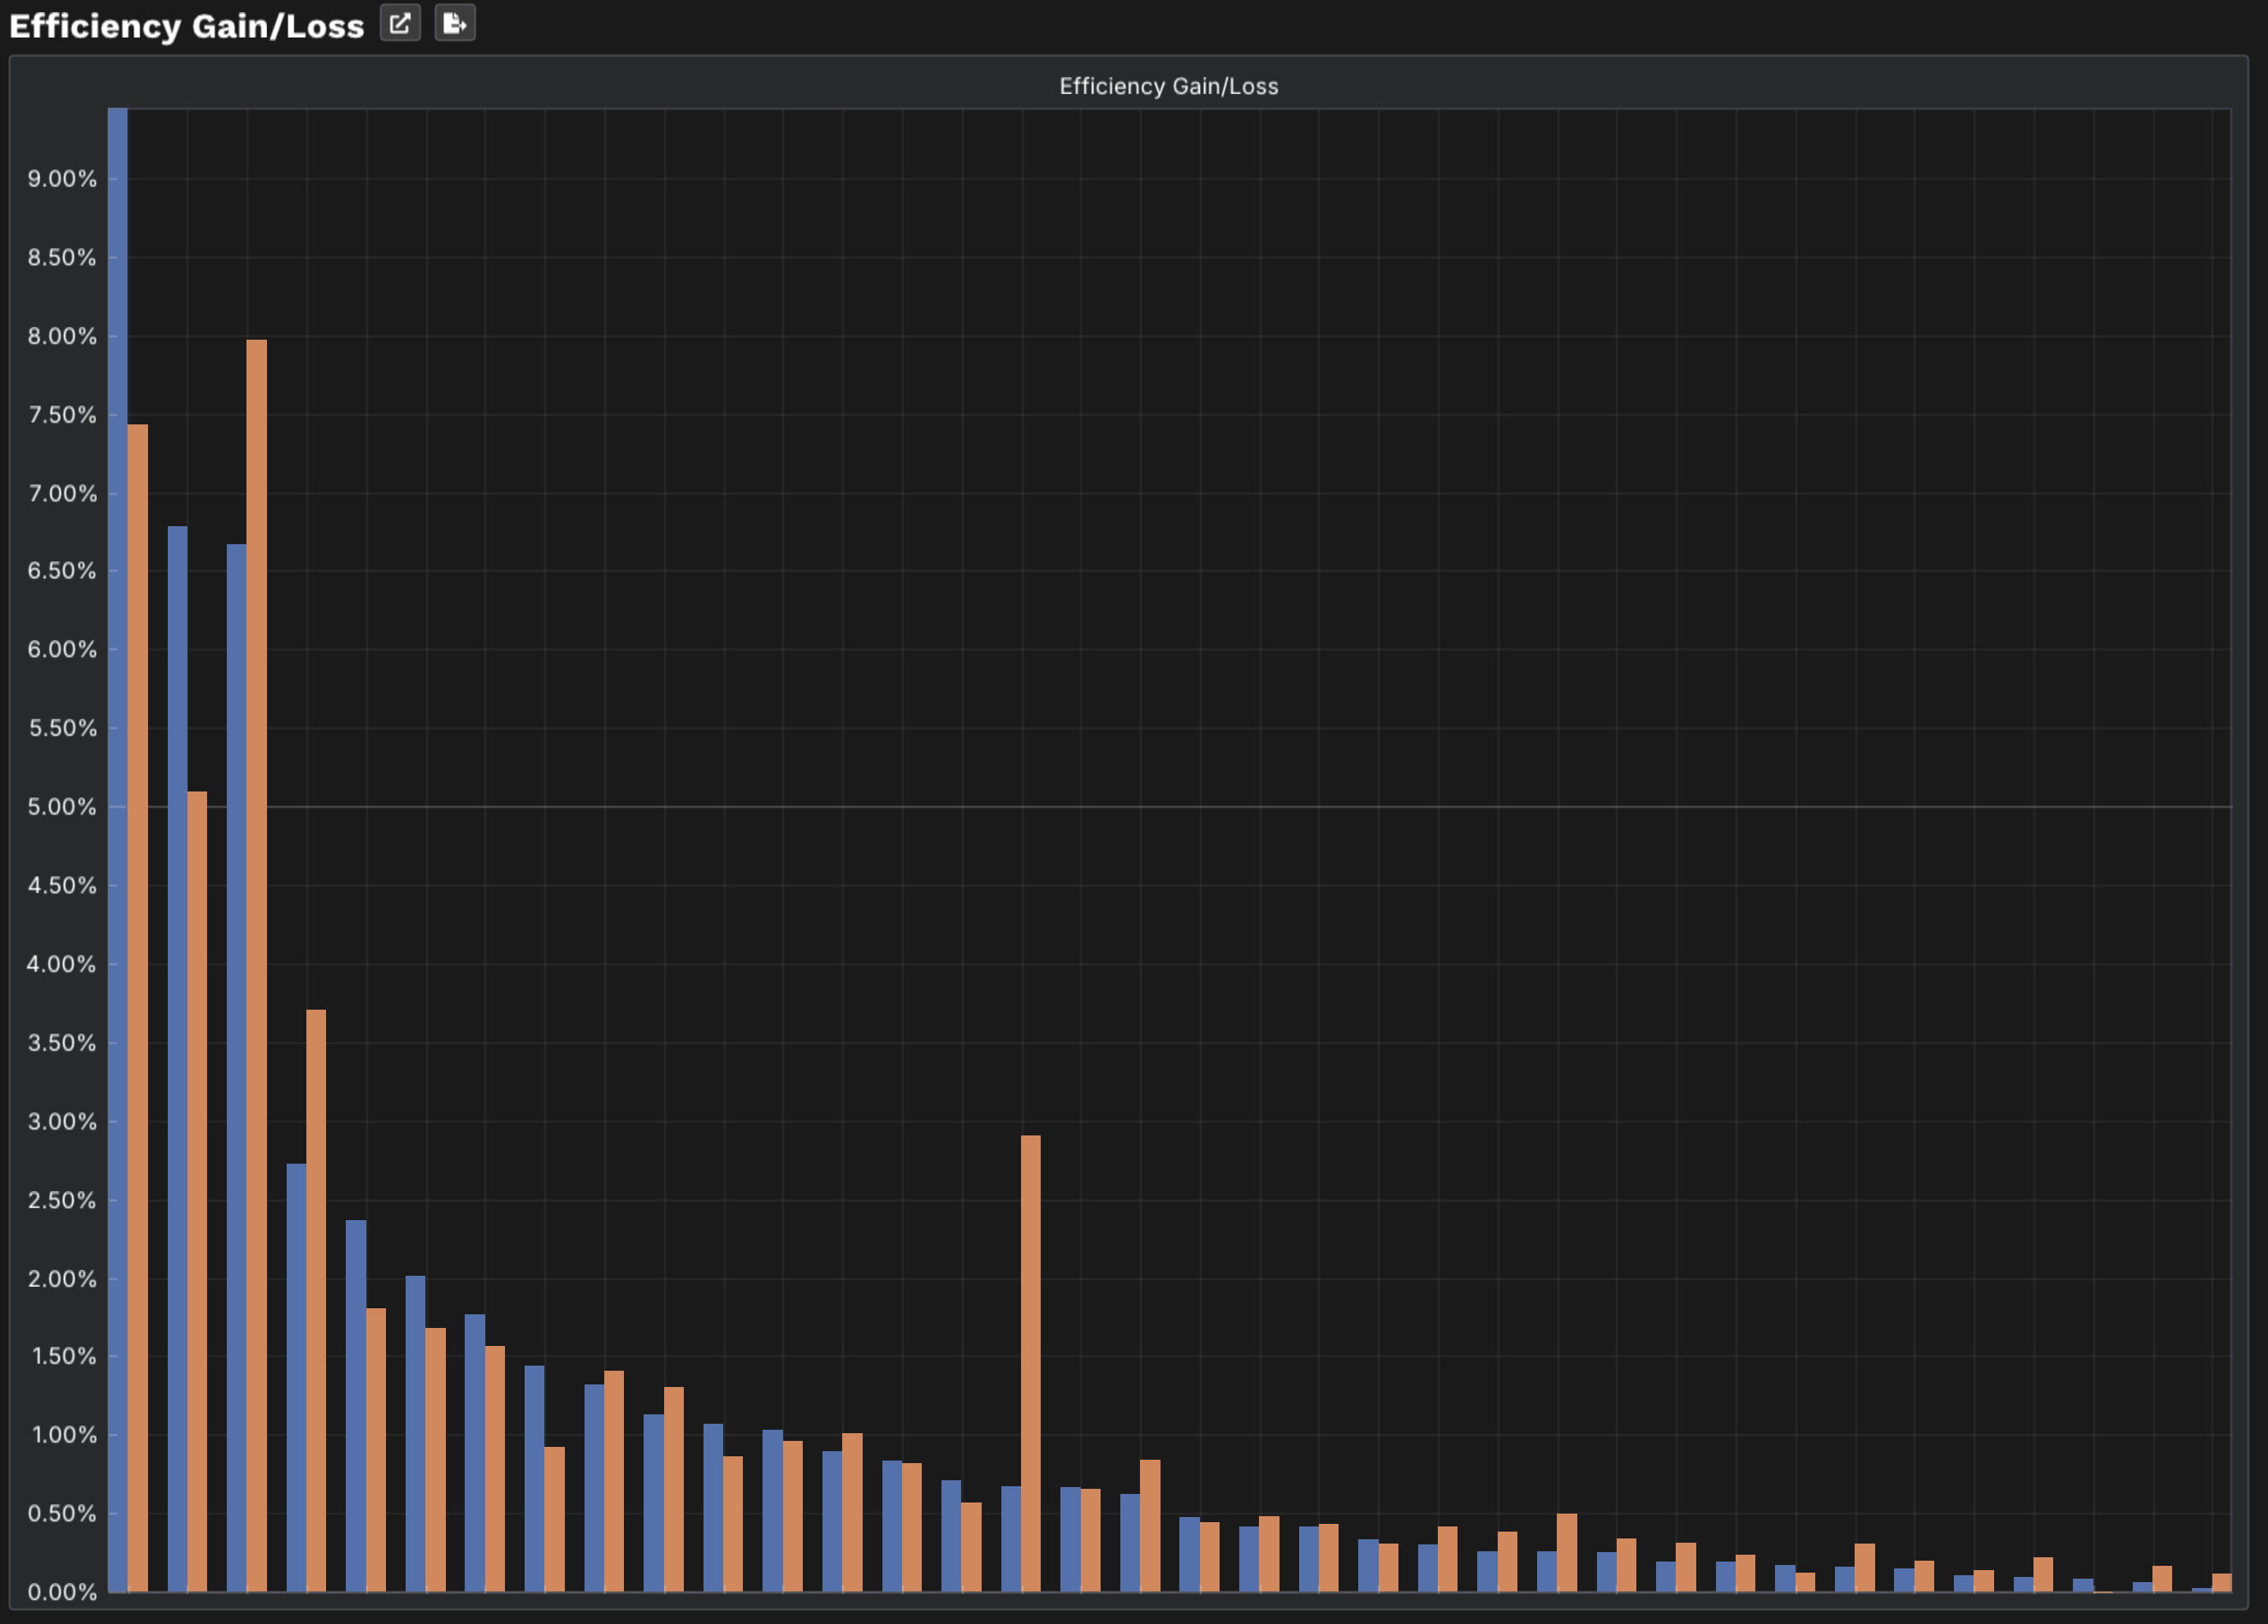
The reveal: Gain ≠ Loss
Labeler — Fix the big event
You recover less than you lost. The rest was absorbed by the system.
Filler — Fix the micro stops
56% more recovery. The cascading losses unlock throughput across the entire line.
On a $50M/year line, that gap is $1.5M left on the table — by following the Loss Tree instead of the simulation.
Why the difference?
120 one-minute micro stops stress the entire system. Each one blocks and starves adjacent machines. The downstream losses never appear under "Filler Micro Stop" in the historian — they show up as idle time on the Labeler, Case Packer, and Palletizer.
The Loss Tree can't see cascading losses. The simulation models them.
"Those 120 one-minute interruptions create cascading problems that don't show up under the original problem's name. You often recover 180–220 minutes — significantly more than the 120 minutes of downtime."— Tom Lange, 36 years Procter & Gamble
The outcome
Without ReliaSim
The CI team fixes the Labeler Misalignment. Capital spent on alignment tooling. OEE improves modestly — but the micro stops continue cascading. The $400K investment recovers less than expected.
With ReliaSim
The simulation identifies the Filler Micro Stop as the higher-value fix. A $50K intervention (automated jam clearing) recovers 56% more throughput than the Labeler fix. The team invests where the validated model says — not where the Pareto guesses.
See if this is your line's story
Book a 15-minute demo and we'll model YOUR line with your data. Not a generic walkthrough — your machines, your interrupts, your answer.