Throughput vs Capacity
Why Rated Speed Never Shows Up
The line is rated at 60 a minute. The shift report says it averaged well under that, and every machine on it can run at 60. Capacity is what the line could make. Throughput is what it does make. The difference isn’t a rounding error: it is the line’s losses, and most of them sit where a capacity sheet never looks.
Throughput vs capacity: the definitions
The two words get used interchangeably, and most confusion about line performance starts there. Three quantities are worth keeping apart:
Three rates for one line
| Quantity | What it means | Where it comes from |
|---|---|---|
| Rated capacity | the rate the line is designed to run with nothing going wrong | nameplate speeds, the slowest machine in the chain |
| Effective capacity | rated capacity after the losses you plan for | changeovers, sanitation, planned maintenance, breaks |
| Throughput | good units actually delivered per unit of time | the end of the line, after everything |
Throughput is always the smallest of the three. Capacity is a property of the equipment and the plan. Throughput is a property of the line as it runs, including every unplanned stop, every slow stretch, every rejected unit and every minute a healthy machine spent waiting on another one.
The throughput formula
For a single machine the throughput formula follows directly from OEE:
Throughput from OEE
| Good units | = rated rate × planned production time × OEE |
| Throughput rate | = rated rate × Availability × Performance × Quality |
For a line, the same formula holds with the line’s rated speed and line OEE, which is not any machine’s OEE and not their average (see line OEE vs machine OEE). That is where the formula stops being useful as a prediction. You can measure line OEE after the fact. You can’t compute it in advance from the machines alone, because it depends on how their losses interact.
Illustrative arithmetic, not plant data
Take a machine rated at 60 units per minute that goes down for a 90-second jam every 12 minutes. Out of every 13.5 minutes it runs for 12, so it is available 88.9% of the time and its effective rate is about 53.3 per minute before any other loss. Over a 480-minute shift that is 25,600 units against a rated 28,800. The rated figure never shows up on the report, because the machine never runs for 480 uninterrupted minutes.
Where capacity goes before it becomes throughput
Between rated capacity and throughput, capacity leaks away in five places. The first three are the familiar OEE losses. The last two don’t appear on any single machine’s report.
1. Changeovers and planned stops
Every format change, sanitation cycle and planned stop takes the line out of flow. These losses take you from rated to effective capacity, and they are usually the best-documented. They are not always the ones that matter. At Bell-Carter Foods the two-hour changeovers on the pitting machines looked decisive; a capacity model found the binding constraints downstream in packaging (case study).
2. Breakdowns
Unplanned downtime is the loss everyone sees. What it costs in throughput depends on where it happens: a stop on a machine feeding a full buffer can cost almost nothing, while the same stop on the constraint costs its full length in finished product.
3. Micro-stops and speed loss
Short stops and running below rated speed land in Performance, and a report often records them as a slower rate rather than as stops. They are frequent enough to keep buffers from refilling, which lets them cost more throughput than their minutes suggest. Micro-stops vs breakdowns covers why.
4. Starving and blocking
A machine that is starved has capacity and nothing to work on. A machine that is blocked has capacity and nowhere to put its output. Either way, that capacity is real, paid for, and unusable. It never shows as downtime on the machine that loses it, which is why a line can report healthy machines and poor output at once. Starved vs blocked explains how to read which is which.
5. Quality losses
A rejected unit consumed capacity at every machine it passed through. Scrap near the end of the line costs more capacity than scrap near the start.
The constraint sets throughput
A series line can deliver no more than its most limiting resource allows at that moment. That is the premise of the theory of constraints, and it has a blunt consequence for capacity: adding capacity anywhere except the constraint adds none to throughput. A faster machine upstream of the constraint fills the buffer and then blocks. A faster machine downstream starves.
The practical difficulty is finding the constraint, because it isn’t fixed. When a machine stops and the storage beside it runs out, that machine limits the line, whatever its rated speed. Minutes later something else does. Product mix and the schedule move it as well.
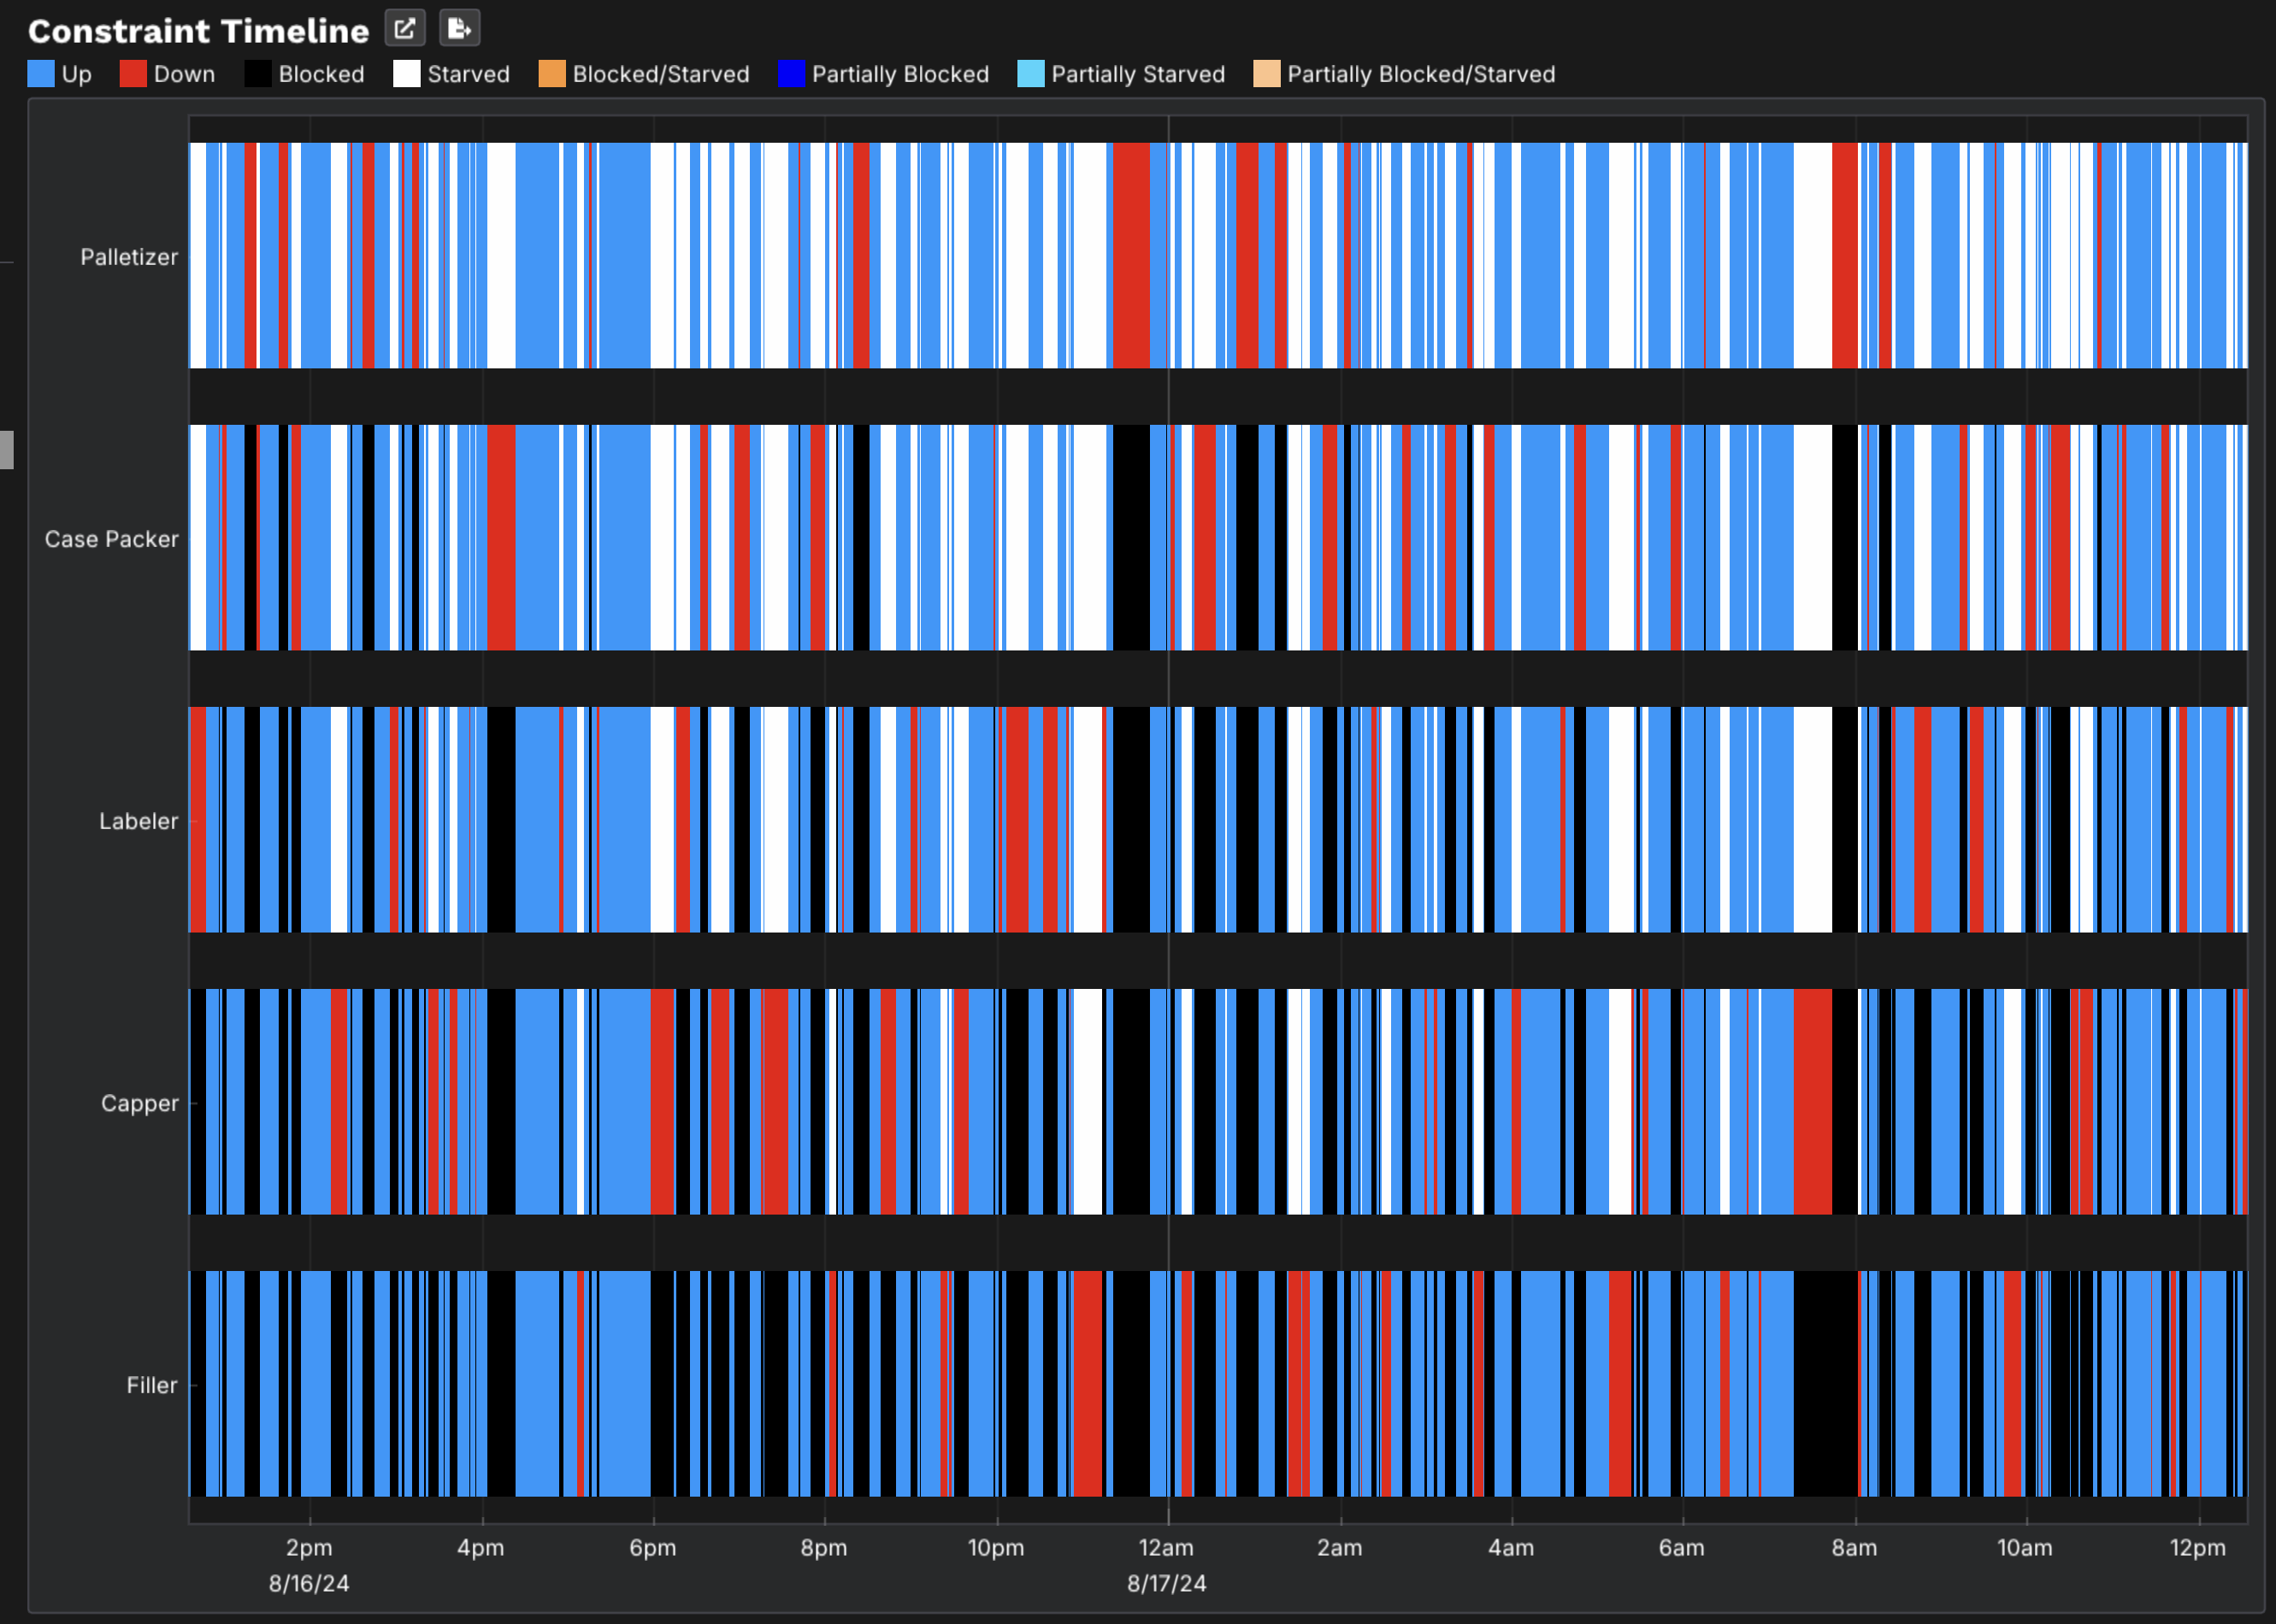
The signals that locate it are the ones in the hidden bottleneck: the constraint is the machine that is neither starved nor blocked, buffers that run full point downstream to it, and buffers that run empty point upstream. A machine that is mostly blocked is telling you its extra capacity is already unused.
Why rated capacity never shows up
A capacity spreadsheet takes each machine’s rate, applies an average availability and takes the minimum. The answer is always too high, and not by chance. Averaging removes the variability that makes a real line fall short: the stop that outlasts a buffer, the run of stops that drains it, the stoppage that cascades into three other machines. Spreadsheet, AI, or simulation? explains why the error only runs one way.
On ReliaSim’s Buffer-Options demo bottling line, the same five machines and three buffers make 525,600 pallets in a year with every failure mode removed. That is the line’s capacity. With its real failure modes the line makes 286,423 pallets and runs at 54.5% efficiency (The Hidden Factory). Nothing about the rated speeds changed between the two runs. The difference is losses, and how they interact across the line.
Throughput isn’t one number. The same line with the same data produces a different output every week, because stops arrive at different times. A plan built on the average week comes up short in roughly half of them. A validated model run many times gives the distribution, so you can plan against the weeks you actually get.
Planning capacity against throughput
The useful questions are about throughput, not capacity: will this line make next year’s volume, and if not, which change closes the gap? Answering them means modeling the line as it runs: each machine’s rate, each failure mode’s time-to-failure and time-to-repair distributions, the buffers and conveyors between them, and the schedule. Validate that model against the line’s own history, then test each option: a faster machine, a bigger buffer, a removed failure mode, an extra shift.
Built from per-failure-mode interrupt data and validated against line history, a ReliaSim model can match measured OEE within 1%. The published Fischel & Lange (WSC 2020) food-plant model, rebuilt in ReliaSim and independently validated by Tom Lange, is the public proof point (Within 1% of measured OEE). With a validated model, capacity planning becomes a set of runs instead of a set of assumptions. See capacity planning simulation for the method.
Frequently asked questions
What is the difference between throughput and capacity?
Capacity is the rate a line could produce: rated capacity with nothing going wrong, effective capacity after planned losses such as changeovers. Throughput is the rate of good units the line actually delivers, after every unplanned stop, slow stretch, reject and minute spent starved or blocked.
What is the throughput formula?
For a single machine, good units = rated rate × planned production time × OEE, so the throughput rate is rated rate × Availability × Performance × Quality. For a line the same formula holds with line OEE, which has to be measured or simulated because it depends on how machine losses interact.
Why is throughput lower than rated capacity?
Because capacity leaks away before it becomes output: changeovers and planned stops, breakdowns, micro-stops and slow running, starving and blocking between machines, and quality losses. Starving and blocking never appear as downtime on the machine that loses the capacity.
Does adding capacity increase throughput?
Only at the constraint. Extra capacity anywhere else shows up as a fuller buffer, more blocked time or more starved time. And because the constraint moves with downtime, mix and schedule, the gain from elevating it lasts only until the next machine takes over.
How do you calculate the capacity of a production line?
Rated capacity is set by the slowest machine’s rated speed; effective capacity subtracts planned losses. A spreadsheet that applies average availabilities to those rates overstates what the line will produce. A validated simulation run many times gives the throughput distribution to plan against.
Watch capacity turn into throughput
The ReliaSim Sandbox runs a bottling line in your browser. Remove the interrupts to see its capacity, put them back to see its throughput. No signup.
Open the sandbox → Find the bottleneckWant to see it on a real line first? Read the case study — or schedule a call.