How Big Is Your Hidden Factory?
Asset Efficiency vs OEE, and Why the Answer Depends on the Denominator
The hidden factory is the production you could get from equipment you already own, without buying anything. Everyone agrees it exists. Very few plants can put a number on it, and the reason is the metric they use to look for it. OEE and Asset Efficiency can describe the same shift and differ by thirty points, and nothing but the denominator changes.

The idea, and why it keeps resurfacing
Armand Feigenbaum's original observation was that a plant contains a second, invisible plant inside it: the capacity consumed by rework, waiting, and everything else that isn't production. Sixty years later the term has broadened to mean the whole gap between what your equipment could physically make and what it actually made.
It keeps coming back because it's the cheapest capacity in manufacturing. A recovered hour on existing equipment needs no capital request, installation, commissioning or floor space.
Why your OEE can't find it
OEE measures against planned production time. Time you deliberately didn't schedule, like the unstaffed shift, the quiet week or the plant holiday, is left out of the denominator by design. That's correct for OEE, which exists to grade execution against a plan.
The hidden factory lives largely in that time.
Where the hidden factory hides
| Layer | What it is | Does OEE see it? |
|---|---|---|
| Unscheduled time | hours the asset existed and you chose not to run | No, excluded by definition |
| Downtime in scheduled hours | breakdowns, changeovers, minor stops | Yes (Availability) |
| Running below rate | slow cycles, reduced speed | Yes (Performance) |
| Product not made right | scrap, rework, startup yield | Yes (Quality) |
A plant running two shifts of a possible three is holding roughly a third of its capacity in the layer its headline metric can't see. On a five-day operation the invisible layer is nearer 29% of the calendar before a single breakdown is counted.
Measuring it: production over a perfect calendar
The measurement isn't complicated once you accept the denominator. Take everything the asset could have produced running perfectly for every minute it existed, and compare it against what it actually produced.
That ratio is what we call Asset Efficiency, and its complement is the hidden factory. The section on Asset Efficiency vs OEE below explains why we use that denominator and why it parts company with OEE on any plant that doesn't run 24/7.
The denominator isn't a theoretical construct, because you can run it. Turn every interrupt off and simulate the same line over the same calendar, and the model reports the ceiling directly.
That number is the denominator, and you can check it against the same line running with its real failure modes. Run both over a full year and the two screens report the answer directly, with no arithmetic needed.
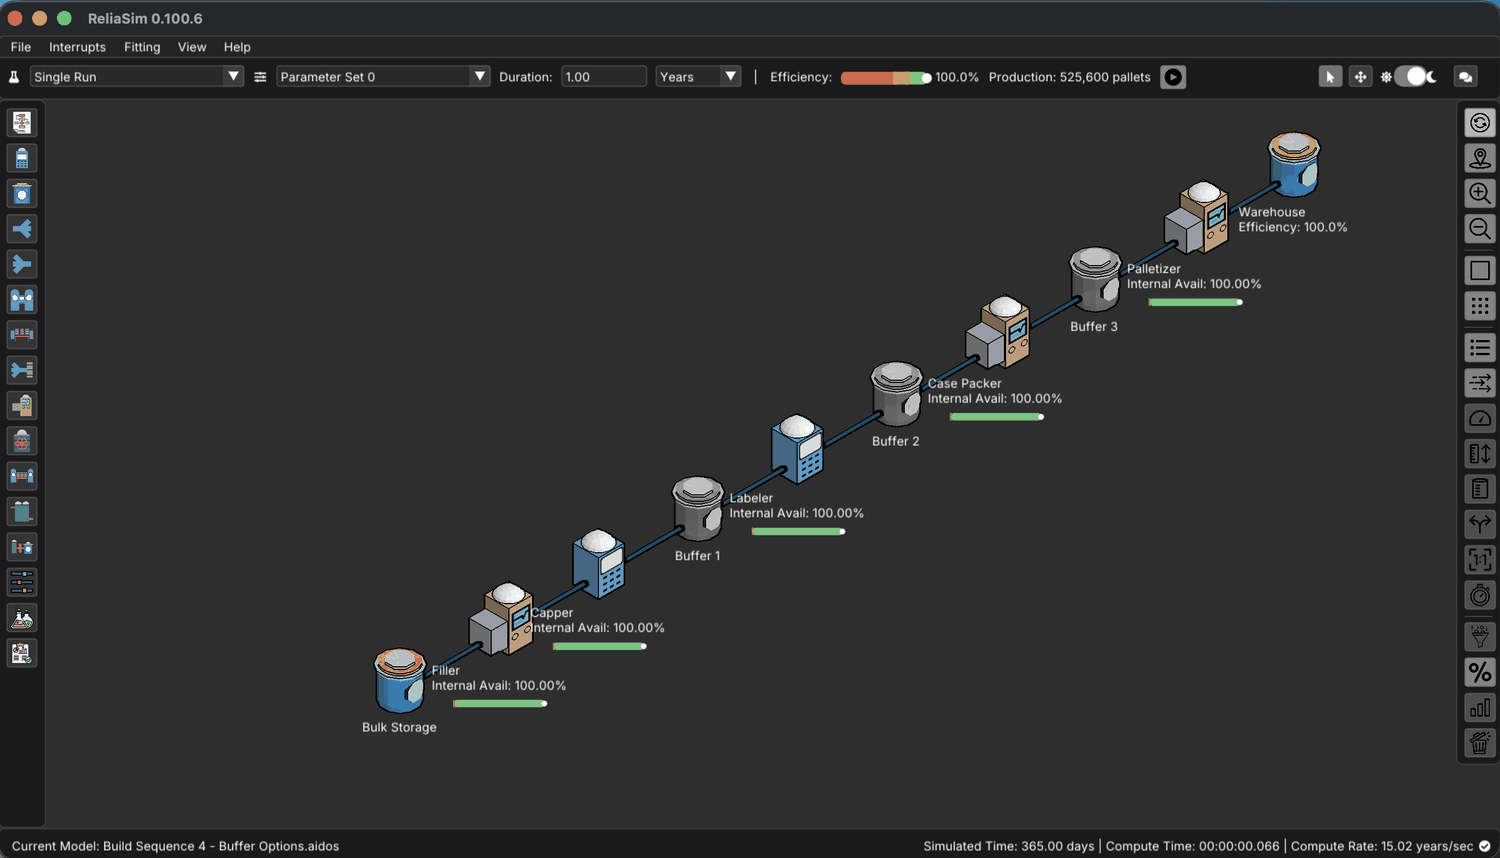
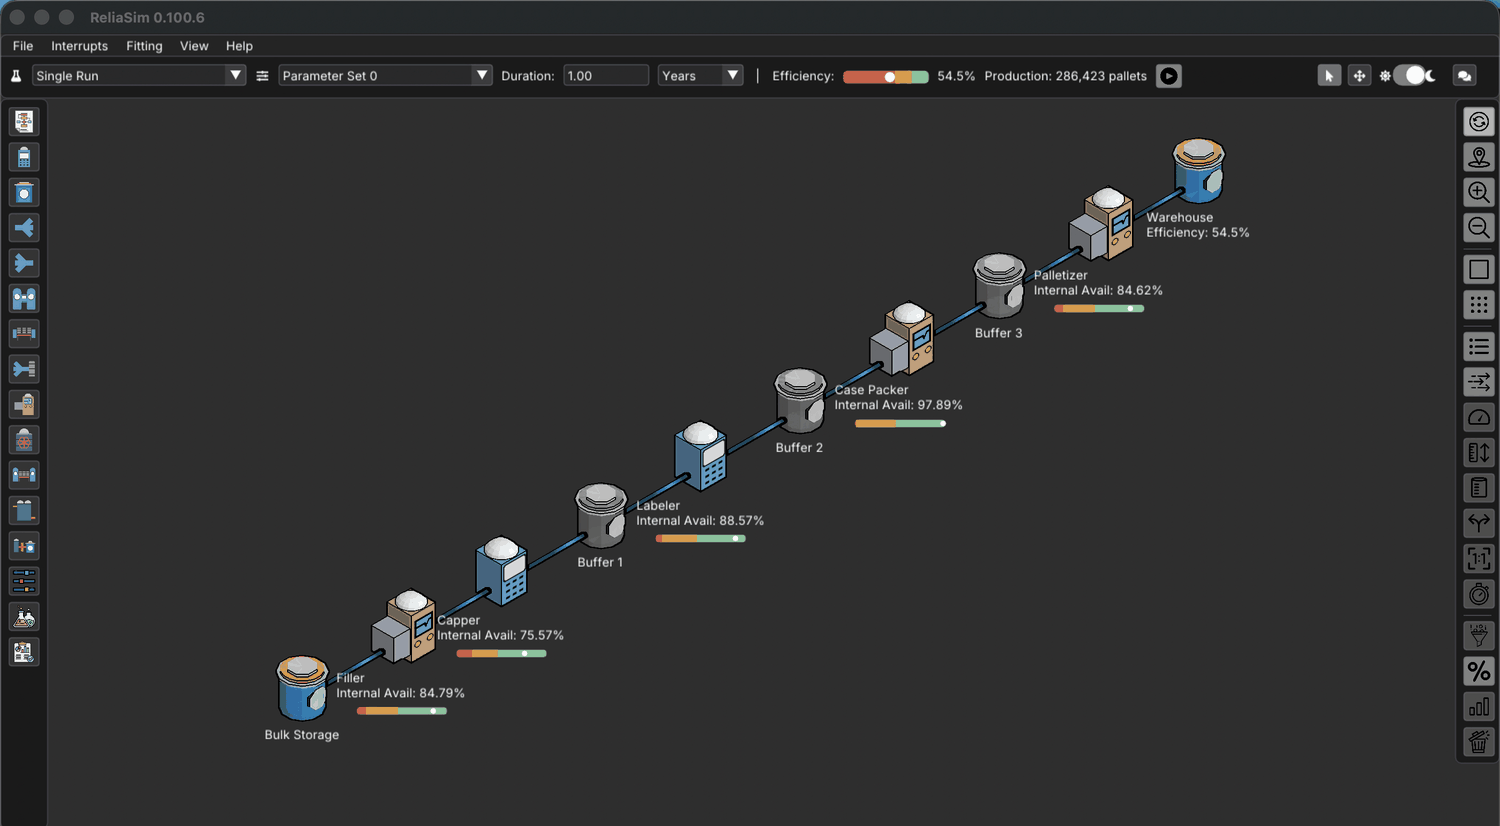
The line made 286,423 of a possible 525,600 pallets. The other 45.5% is the hidden factory. It's one run divided by another, with both numbers on screen.
Asset Efficiency vs OEE vs TEEP: when they match and when they won't
On a plant that runs around the clock, a simulated Asset Efficiency and a reported OEE can land within a point of each other. On a plant that runs one staffed shift, the same two numbers can differ by thirty. The industry has never fully agreed on which minutes belong in the denominator.
A plant engineer once asked us whether our Efficiency figure was based on 24/7 possible asset utilization, the way their TEEP metric is, or on 24/5 production time. It's a sharper question than it looks, and it's the one to settle before anybody compares a model against a dashboard in a meeting.
If you don't, someone will put a simulated Efficiency next to the plant's OEE, see a gap of twenty or thirty points, and conclude that the model is broken.
One shift, two denominators
Take a line that runs at an ideal rate of 100 units per minute. It's staffed for a 900-minute operating window, which leaves out sanitation and the unstaffed shift. Over one day it produces 72,000 units.
Now measure that same output two ways.
The same 72,000 units, measured twice
| Basis | Time counted | Potential output | Result |
|---|---|---|---|
| Staffed operating window what the line was asked to do |
900 min | 100 × 900 = 90,000 | 80.0% |
| A perfect day what the asset could theoretically do |
1,440 min | 100 × 1,440 = 144,000 | 50.0% |
Nothing about the shift changed between those two rows. Only the amount of time in the denominator moved, and that alone is worth thirty points.
OEE counts the time you planned to run
OEE multiplies three factors: Availability × Performance × Quality. Its denominator is planned production time, so the unstaffed third shift, the sanitation window and the plant holiday don't count against it. That makes OEE the right measure of how well you executed the plan you made. It says nothing about whether the plan itself left capacity on the floor.
TEEP counts all the time there is
TEEP takes OEE and multiplies it by Utilization, the share of calendar time you chose to schedule. Its denominator is every hour the asset existed, whether staffed or not. A line running beautifully on one shift can post excellent OEE and mediocre TEEP at the same time, and both are true.
TEEP answers the capital question of how much of this asset you're actually using.
Asset Efficiency counts production over potential for the modeled period
A simulation reports the ratio it can defend: units produced, divided by units the line would have made at its ideal rate with no interruptions, over the period modeled. It's built like TEEP, since it counts time you weren't staffed. It isn't textbook TEEP, though, because the horizon is the modeled period rather than a rolling 24/7 calendar. Model one production day and no weekend hour is credited or debited.
Efficiency tells you how much the line made out of everything it could physically have made.
Which minutes count?
Under the arithmetic is a choice people rarely make out loud, and it splits the industry much the way buffer sizing does. The real question is which minutes belong in the denominator at all, not how to compute the ratio.
- Scheduled-time accounting. Count only the hours you planned to produce. A shift you chose not to staff, a line you idled for a slow week and a plant holiday don't count against the number.
- Every-minute accounting. Count every hour the asset existed. If the line could physically have run and didn't, that shows up.
Both are defensible and both are in wide use, but they behave differently. The difference that matters most is that a scheduled-time number can be improved by scheduling less. Cut the third shift and availability against plan goes up, while the asset produces no more than it did before. The figure answers "how well did we execute the plan" and not "how much of this asset are we using".
Where we land. ReliaSim® follows the convention many round-the-clock global manufacturers already use, where every minute counts. In a simulation the denominator is the full modeled period, staffed or not. It's the stricter basis. On the same line it gives a lower headline number than scheduled-time accounting, and we want it that way. A model exists to answer questions about the asset, and the asset doesn't stop existing when the schedule does.
If your plant reports on scheduled time and you want to compare, reconciling the two is simple. Multiply the scheduled-time figure by the share of calendar time you actually scheduled. That puts it on the same basis the model uses, and any difference left after that is about the model, not the bookkeeping.
What about quality?
OEE's third factor is Quality, the share of output that was actually saleable. It's easy to assume a simulation ignores this and counts every unit the line pushed out.
It doesn't have to. Several node types, and sets of nodes arranged as a construct, can be designed to represent scrap or rework. Model it and the simulation removes or recirculates rejected units the way the line does, so what it reports is good output. The Quality factor is then already inside the numerator, exactly where OEE puts it.
So a simulated Efficiency with scrap modeled is the same measurement as OEE with a different denominator, not a loosely related figure. Availability shows up as interrupts, Performance as rate loss and Quality as modeled scrap or rework. All three factors are there, and only the time basis differs.
If quality isn't modeled, the gap runs both ways. The simulated numerator then counts units the plant would have rejected, which pushes Efficiency up, while the wider denominator pushes it down. Two errors in opposite directions are far harder to explain in a meeting than one. Before comparing anything to a plant number, check whether scrap or rework is represented at all.
Scrap and rework aren't interchangeable here. A scrapped unit leaves the count; a reworked one comes back and is eventually good. If the plant's Quality factor is first-pass yield, a model that recirculates rework will read slightly high against it, so check that before you set the two side by side.
When the two numbers converge
The gap disappears completely in one case, a plant that really does run 24/7.
Schedule every hour and Utilization goes to 100%. TEEP collapses onto OEE, because there is no unscheduled time left for the wider denominator to count. A simulated Efficiency measured against a perfect calendar and a plant's OEE measured against planned time are then dividing by the same number, and they should agree.
A published validation of a multi-line food plant shows that they do. It matched a one-year simulation to measured OEE within 1%, first in ExtendSim and then in a ReliaSim rebuild (the full validation is written up here).
That validation checks each failure mode, not just the total. A single overall number can be right for the wrong reasons, with one mode overstated and another understated so the errors cancel out. Comparing observed against simulated availability for every failure mode separately can't hide that. ReliaSim builds that comparison in. Below, it's run on the bottling line demo model, which you can open yourself.
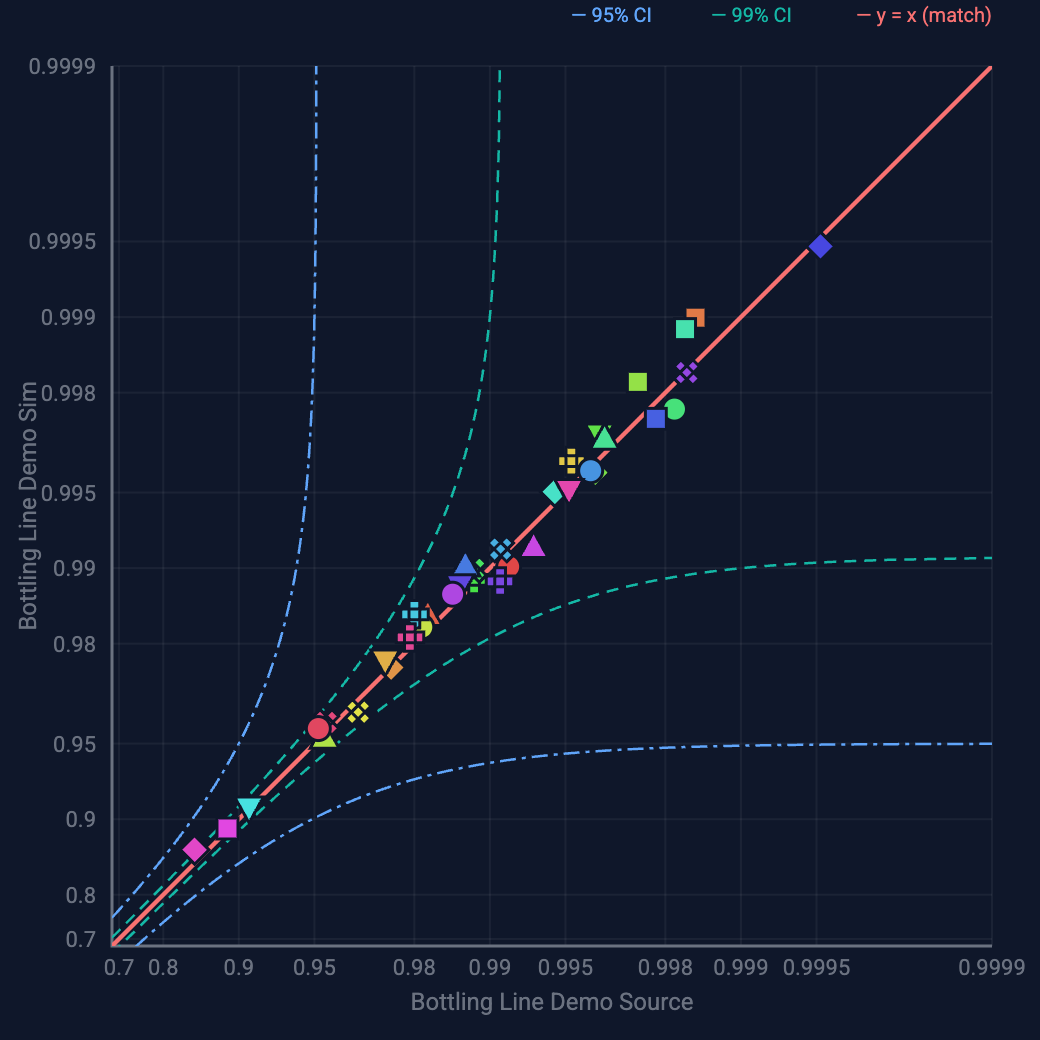
Points on the match line across the full range mean each failure mode was reproduced on its own terms, so the total is right because the parts are. It's also how you'd validate your own line.
Which number to use, and when
- To judge the shift you ran, use OEE. It measures execution against the plan, which is what a shift team controls.
- To judge whether to buy another line, use Efficiency or TEEP. If you're at 50% of physical potential, a second line may be the most expensive way to solve a scheduling problem.
- To size the hidden factory, use Efficiency against a perfect calendar, as in the 286,423-of-525,600 run above.
- To compare a model to history, use neither ratio and compare the quantities instead. Units produced against units produced needs no denominator at all, so there is nothing to disagree about.
The practical rule. Never put a simulated Efficiency and a reported OEE on the same axis against the same 100% line. A footnote explaining the difference won't survive contact with the chart. People trust the picture over the caption, and the picture will be wrong.
When a model and a dashboard disagree, check the denominator before you check the model. That's nearly always where the gap is.
Not all of it is recoverable
A number nobody can act on is worse than no number. Some of the hidden factory can't be recovered at any price, and a credible estimate says which parts.
- Physics and regulation. Sanitation windows, mandated changeover procedures, planned maintenance. These aren't waste. They're the cost of operating legally and safely.
- Demand. Capacity you can't sell isn't an opportunity. A third shift that produces inventory nobody ordered converts one problem into another.
- Labor and supply. The staffing or raw material for the extra hours may not exist, and that constraint may be firmer than the equipment one.
What's left is the hidden factory you can actually recover. It's usually still large, because the interruptions inside the hours you already staff are rarely as small as they look. Frequent short stoppages do more damage than their minutes suggest, since a line with no slack passes every one of them along.
You can't read from a loss report which fix returns what, because losses interact. The guide on which of the Six Big Losses to fix first covers the experiment that ranks them.
Try it on a real bottling line: the Sandbox question What should we fix first?, or one move in Beat the Bottleneck.
See the losses on a real line
The bottling-line models in the Sandbox’s Lines tier come from a real line and need no install or signup. Their Gain/Loss results show how much OEE each interrupt costs and how much the line could recover in total.
Open the sandbox → How the method worksWant to see it on a real line first? Read the case study or schedule a call.