Is 85% OEE Achievable on Your Line?
The Benchmark Was Never About Lines
World-class OEE is quoted as 85%. It's a real number with a real derivation, but it applies to a single machine. For a line of machines in series it isn't a stretch target. The arithmetic puts it out of reach, and chasing it wastes budget on the wrong thing.
Where 85% comes from
Seiichi Nakajima's benchmark for world-class equipment effectiveness is three factors multiplied:
The world-class benchmark
| Factor | World-class |
|---|---|
| Availability | 90% |
| Performance | 95% |
| Quality | 99% |
| OEE | ≈ 85% |
The number is sound and widely cited. The problem is what happens when it's carried from a machine to a line.
What series topology does to it
Take five machines, each individually world-class at 85%. What's the line worth?
With no buffering between them, every stoppage spreads immediately and the line runs only when all five run, so availability multiplies.
Five world-class machines in series
| Buffering | Line OEE | Why |
|---|---|---|
| None | 0.855 ≈ 44% | every stoppage propagates to the whole line |
| Infinite | 85% | stages fully decoupled; the slowest sets the pace |
| Real | somewhere between | depends on buffer size versus stoppage length |
Those two figures describe the same five machines. The difference is entirely topology and buffering.
So "our line runs at 55% against a world-class 85%" often isn't a performance gap at all. It can be a line whose every machine is already excellent, assembled in a configuration where 85% was never available. Reported as a shortfall, it funds equipment projects that can't deliver, because the constraint is the arrangement rather than any of the parts.
The right question
The question isn't "are we at 85%?" It's "what's the ceiling for this line, with this topology, this buffering and this failure profile, and how far below it are we?"
You can answer it with two runs of a model of the line as built. First run it with its real interrupts. That's what this topology, buffering and failure profile should deliver, and comparing it with your measured OEE shows how much you're losing to execution. Then remove every interrupt and run it again (the perfect-calendar run). That's the most this configuration can produce. The gap between the two runs is the most that reliability work could ever recover on this line, measured against your line rather than a single machine in a textbook.
Two lines can be equally far from 85% with completely different amounts of available improvement, and only one of them has a problem worth funding.
What the ceiling tells you to do
- If measured OEE sits well below the as-built run, the shortfall isn't in the failure data. Look at execution: response times, speed losses and changeovers the model doesn't carry.
- If the as-built run sits well below the interrupt-free run, failures are costing you real output, and the equipment work is justified. The recoverable-throughput ranking tells you which machine. Where one machine's stops spread down the line, buffering or decoupling can be cheaper than fixing the machine.
- If even the interrupt-free run falls short of the target, no amount of maintenance reaches it and the conversation is about capital, not effectiveness. It's better to find that out before a year of improvement projects.
None of this argues against the benchmark. It argues against applying an equipment benchmark to a system without adjusting for what the system does to it. Treating interacting parts as independent is the same error that makes loss trees misrank projects.
An improvement roadmap to 85%
Once you know the ceiling, the next question is the path: which fix first, which next, and how many it takes. The answer comes from engine runs on a model of the line, not judgment. We call the result an Improvement Roadmap.
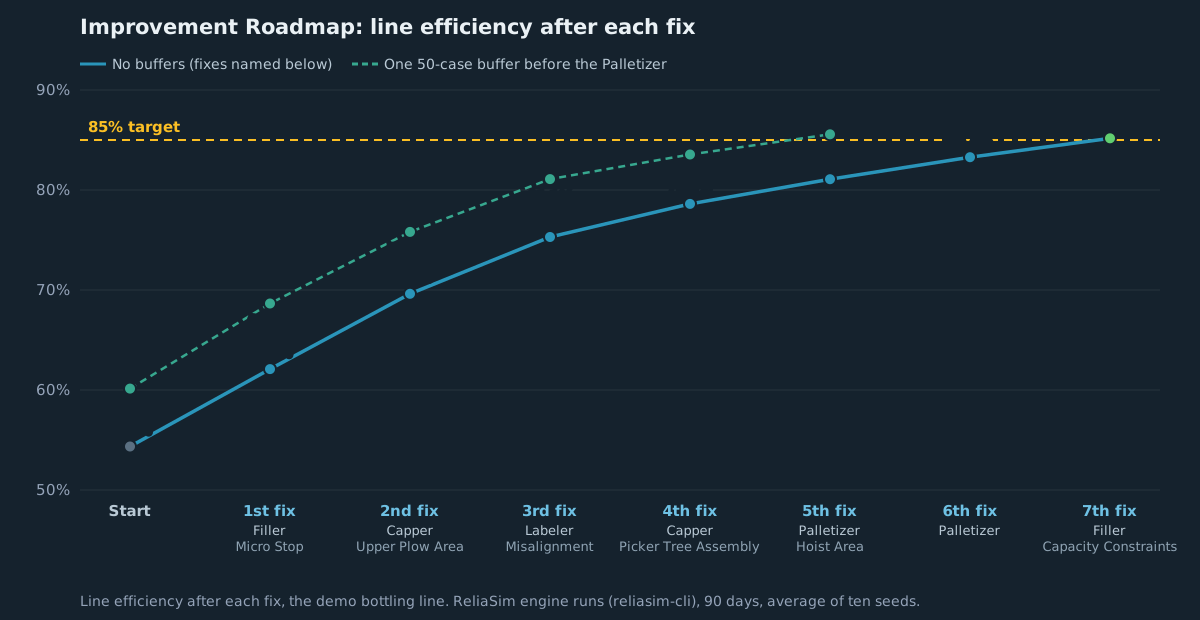
On our demo bottling line it takes seven fixes to go from 54.3% to 85.2%, or five steps with one 100-case buffer before the Palletizer: the buffer and four fixes. None of 2,000 random plans of seven fixes reached 85%; the best got to 79.8%. The full walk-through is in The Improvement Roadmap: which fixes, in what order, and you can build it yourself in the Sandbox.
Try it on a real bottling line: the Sandbox question How do we get to 85%?, or one move in Beat the Bottleneck.
See how much one line could recover
The sandbox has the demo bottling line at four levels of detail, up to five machines with converters and buffers. Its Gain/Loss results show what each interrupt costs and the total OEE the line could recover.
Open the sandbox → The demo modelsWant to see it on a real line first? Read the case study or schedule a call.