How to Find the Real Bottleneck on a Production Line
The slowest machine on your line is rarely the constraint that's actually costing you throughput. Here's how to find the one that is — and prove the fix before you spend a dollar on it.
Walk any plant floor and people will point you to "the bottleneck": the machine with the pile of work in front of it, or the one with the slowest cycle time on the spec sheet. Sometimes they're right. Usually they're not. The station with the biggest pile is often just downstream of the real problem, and the slowest rated machine is frequently not the slowest effective one once you account for how often it stops.
Finding the true constraint is the difference between spending $250k on a faster machine that moves your throughput by nothing, and spending $15k on a buffer that unlocks 8% — because you found where the line is actually losing time.
The bottleneck you can see vs. the one that's costing you
A production line is a chain of dependent stations with variability at every one. Because the stations are coupled, a problem at one shows up as a symptom at another. The classic trap:
- WIP piles up in front of Station B, so everyone "knows" B is the bottleneck.
- But B is piling up because Station C downstream keeps micro-stopping — B is blocked, not slow.
- Speed up B and nothing changes. The constraint was C all along.
The pile of WIP tells you where flow is interrupted, not where the cause lives. To find the cause you have to look at two things the WIP pile won't show you: starvation and blocking.
Three signals that reveal the true constraint
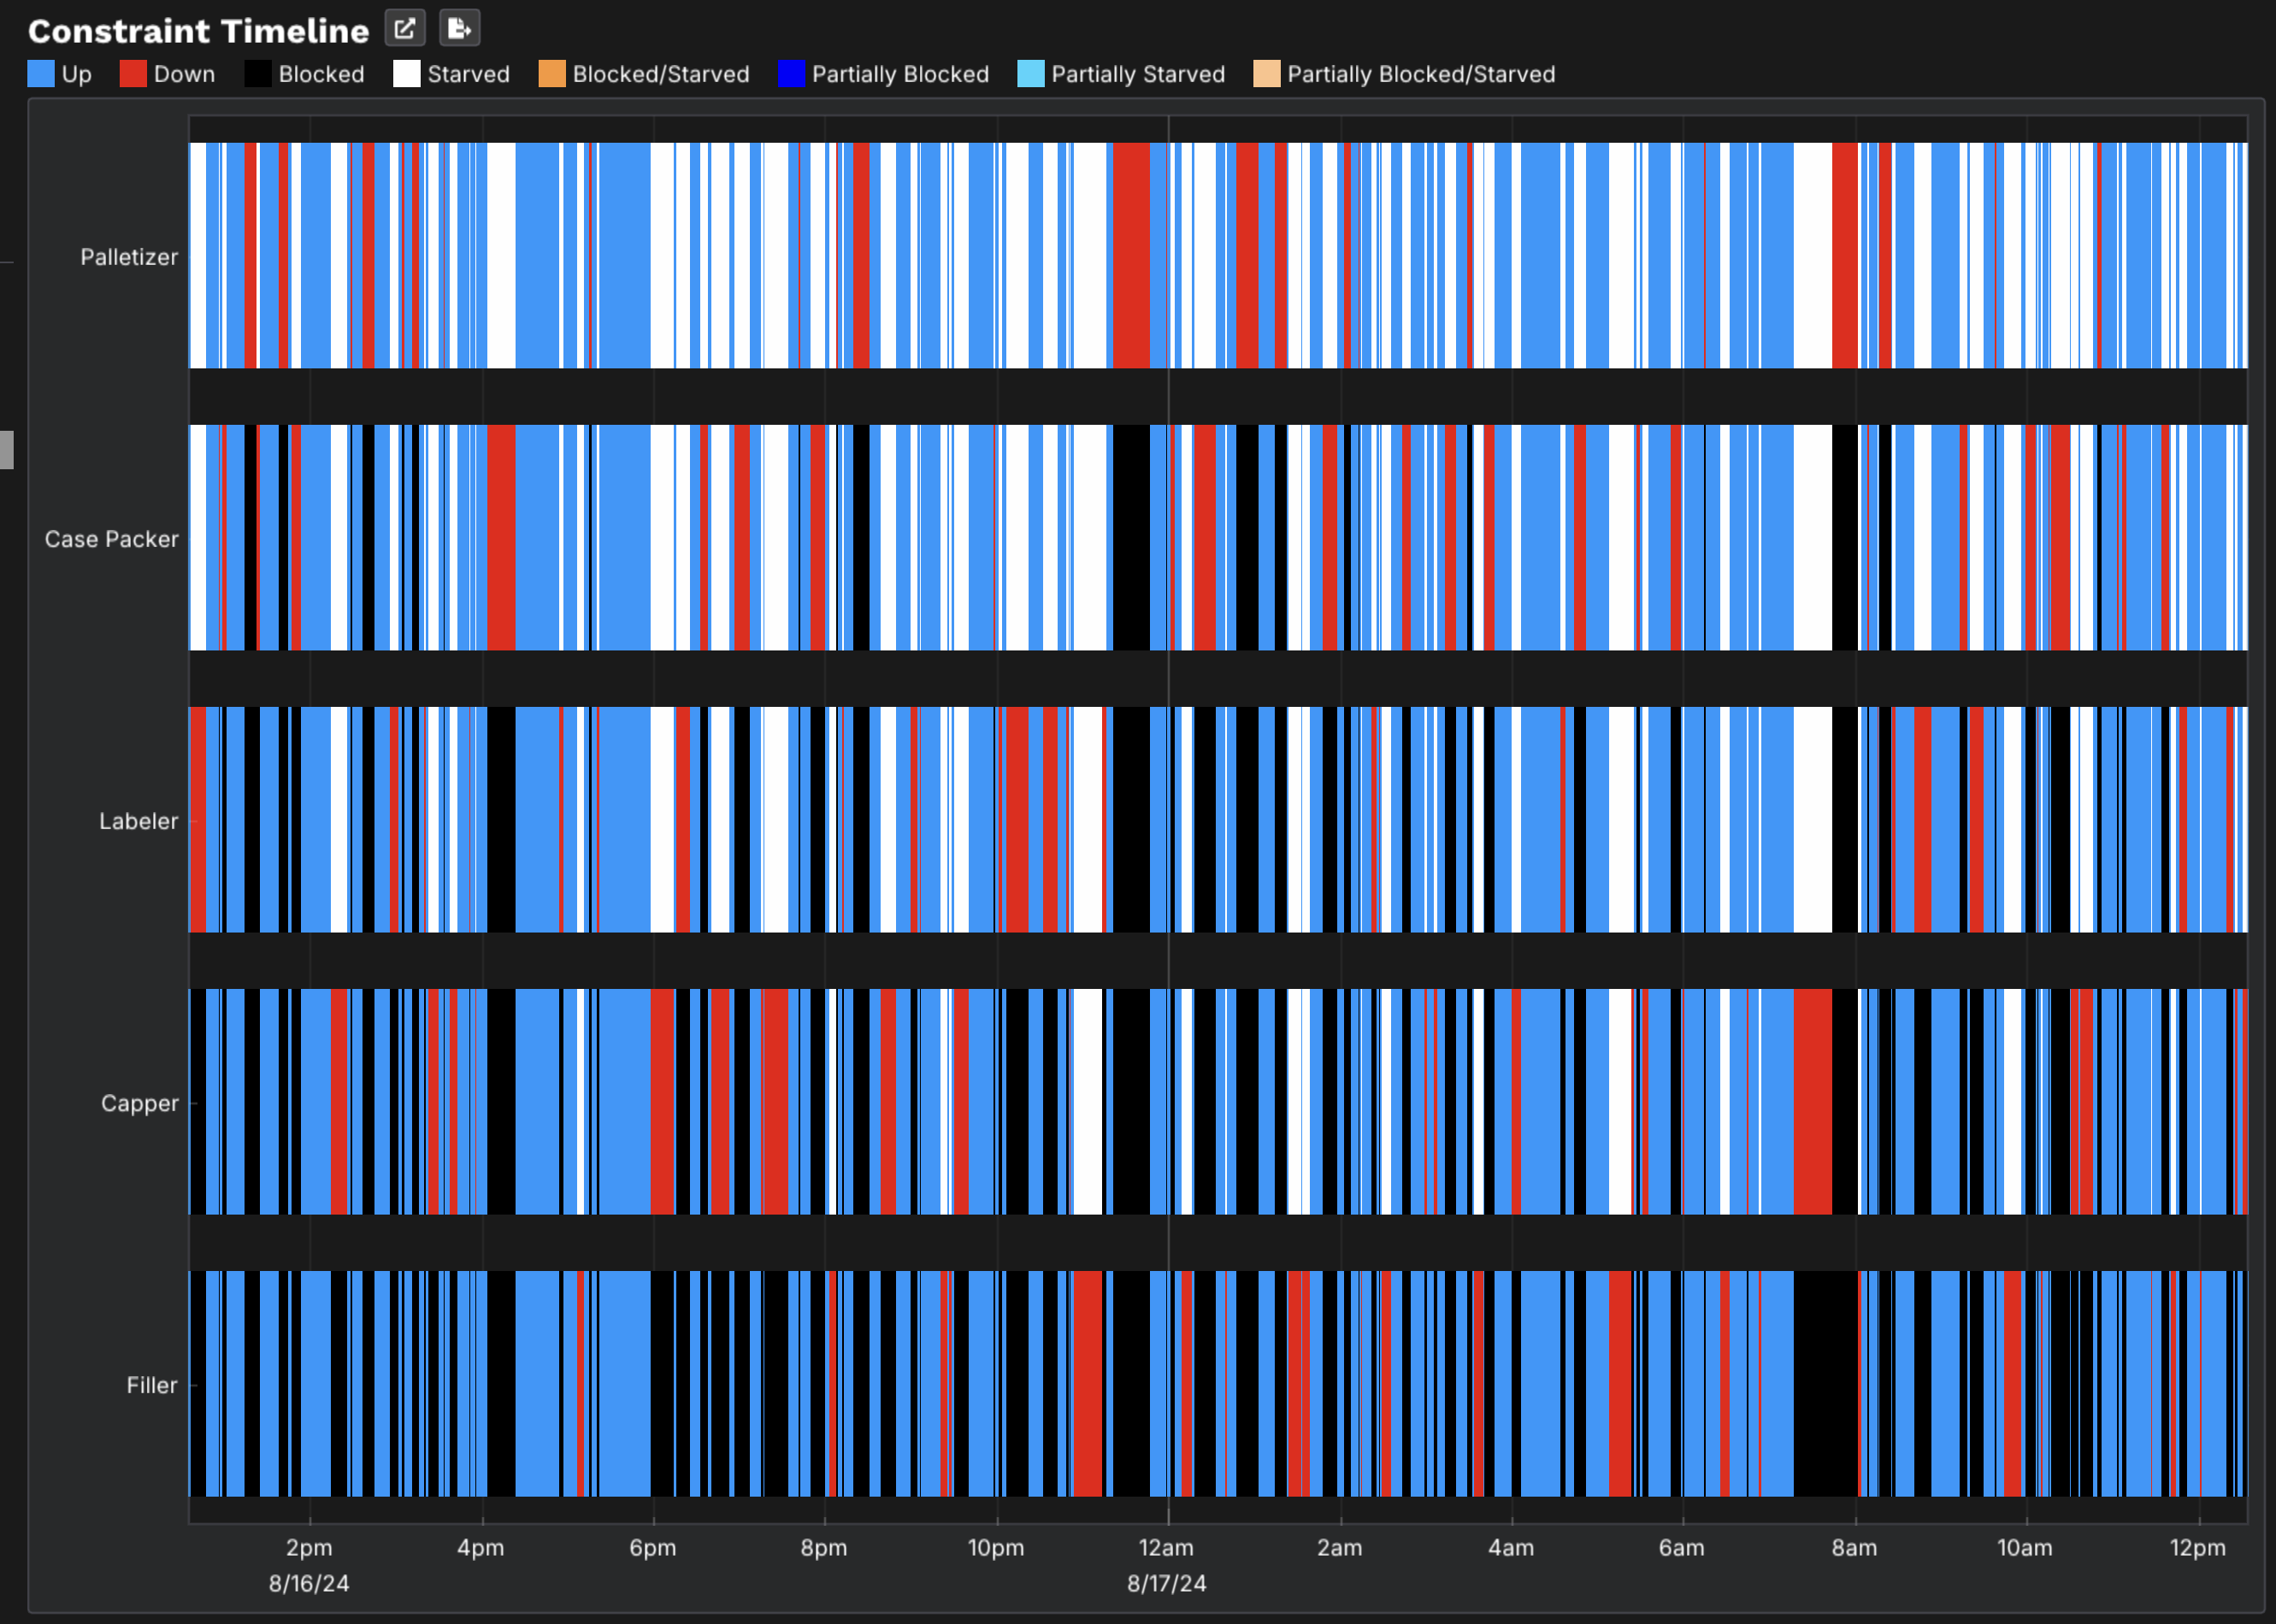
1. The station that is never starved and never blocked
The real bottleneck is the one station that is almost always working because it can never get ahead — it's never waiting for parts (starved) and never waiting for room to pass parts on (blocked). Every other station, by definition, spends some time idle waiting on it. If you can measure starved % and blocked % per station, the constraint is the one whose "running" time is highest and whose starved+blocked time is lowest.
2. Where buffers fill — and which side they fill on
A buffer that's chronically full has a constraint downstream of it. A buffer that's chronically empty has a constraint upstream. Reading the line's buffers as pressure gauges points you toward the constraint faster than cycle-time spec sheets do.
3. Effective rate, not rated rate
A machine rated at 60 units/min that goes down for a 90-second jam every 12 minutes isn't a 60/min machine — its effective rate is far lower, and the variability of those stops ripples downstream. The bottleneck is set by effective throughput under real failure behavior, which is why two lines with identical nameplate capacity can have wildly different output.
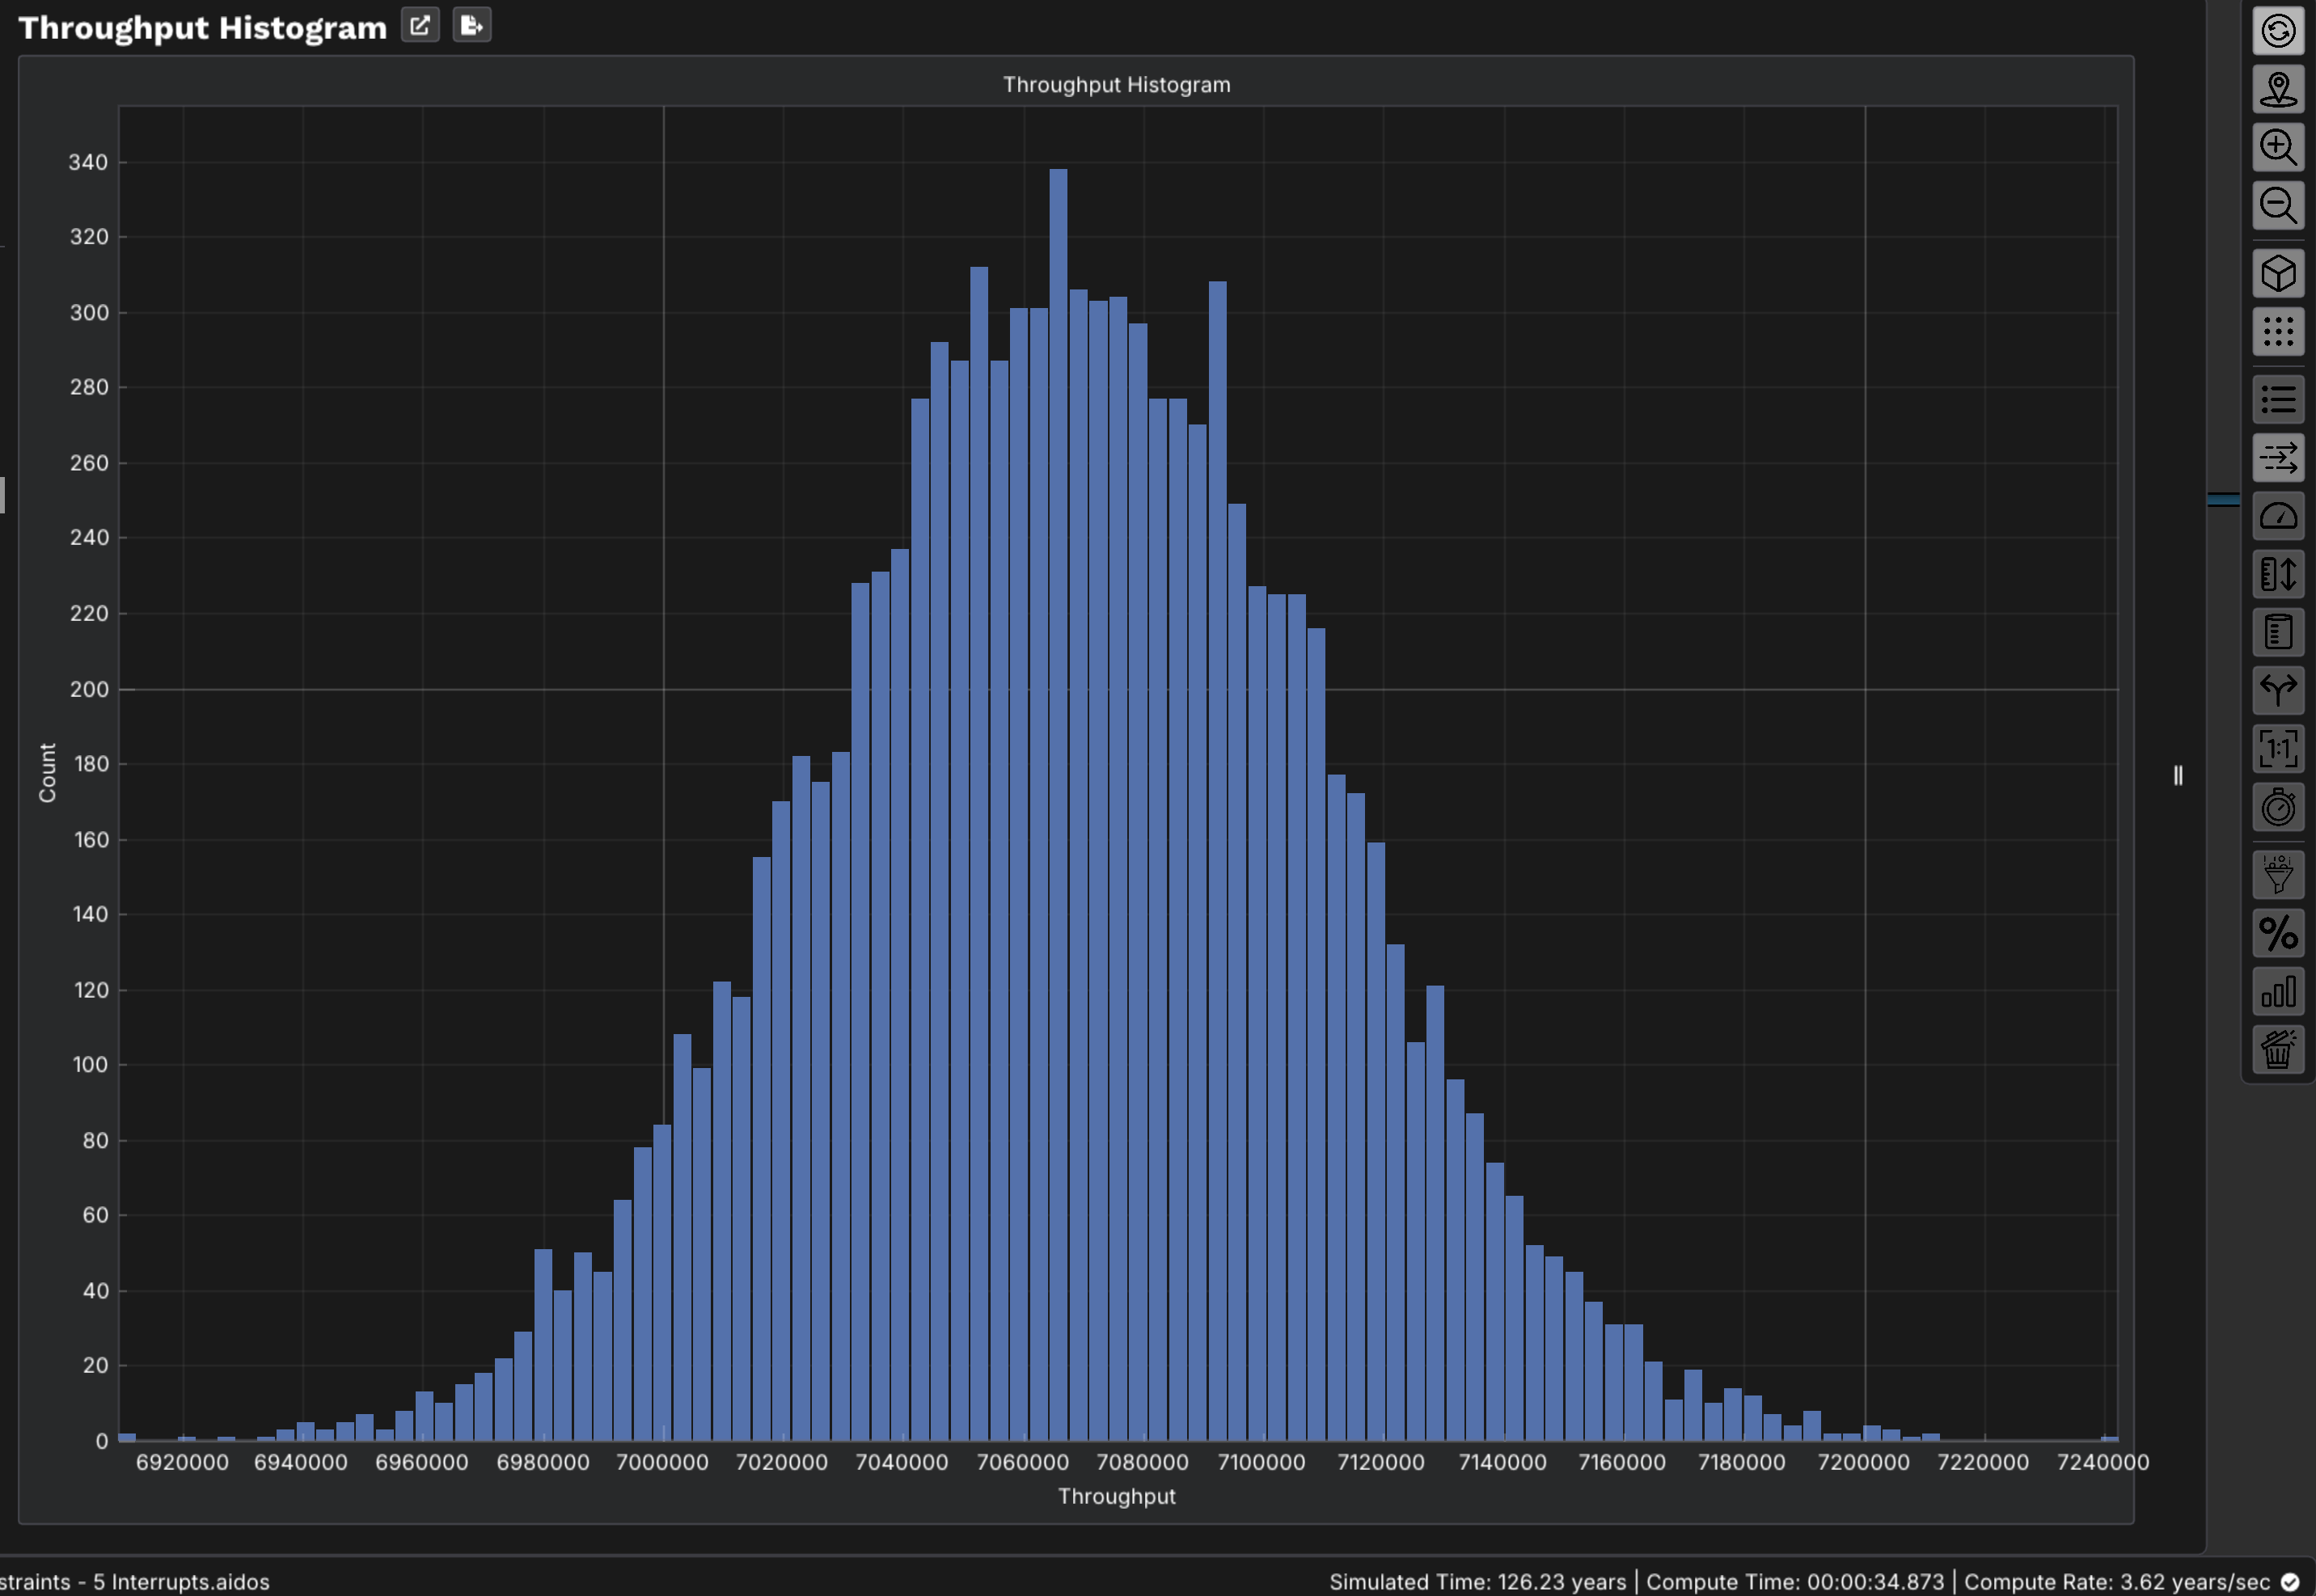
Why averages hide the bottleneck
Here's the part that trips up spreadsheets: if you model each station at its average rate, the line looks balanced and the math says you're fine. Real lines don't run on averages. They run on distributions — and the interaction of variability across coupled stations destroys throughput in ways an average-based calculation literally cannot represent.
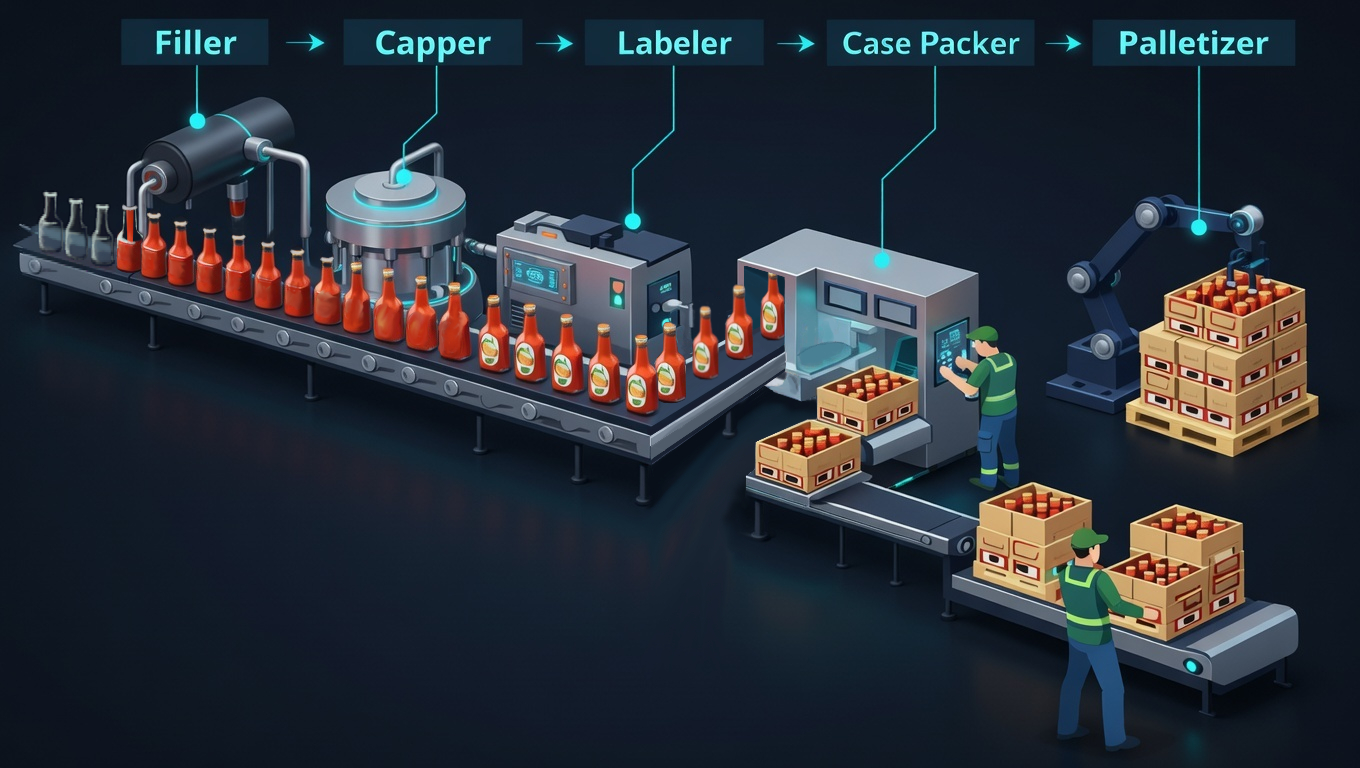
A real example. On one packaging line, the labeler and the filler had nearly identical average rates — on paper, perfectly balanced. But the labeler had frequent, short micro-stops. Each one briefly starved the filler downstream. Individually trivial; in aggregate, those cascading micro-stops were quietly costing double-digit throughput. No average-rate model would ever surface it, because on average, nothing was wrong.
This is the core reason bottleneck-hunting by intuition or by static capacity math fails: the loss lives in the variability and the coupling, not in any single station's average. You need a model that plays the line forward through time, with each station's real failure behavior, and watches where flow actually breaks.
How to prove it before you spend
Once you suspect a constraint, the expensive mistake is to act on the suspicion. The disciplined move is to simulate the line — build a model where each station carries its real cycle time and its real interrupt behavior (how often it fails, how long it's down), run it forward, and read the starvation/blocking and effective-throughput signals directly. Then test the fix in the model: add the buffer, speed up the suspected station, change the maintenance interval — and see whether throughput actually moves.
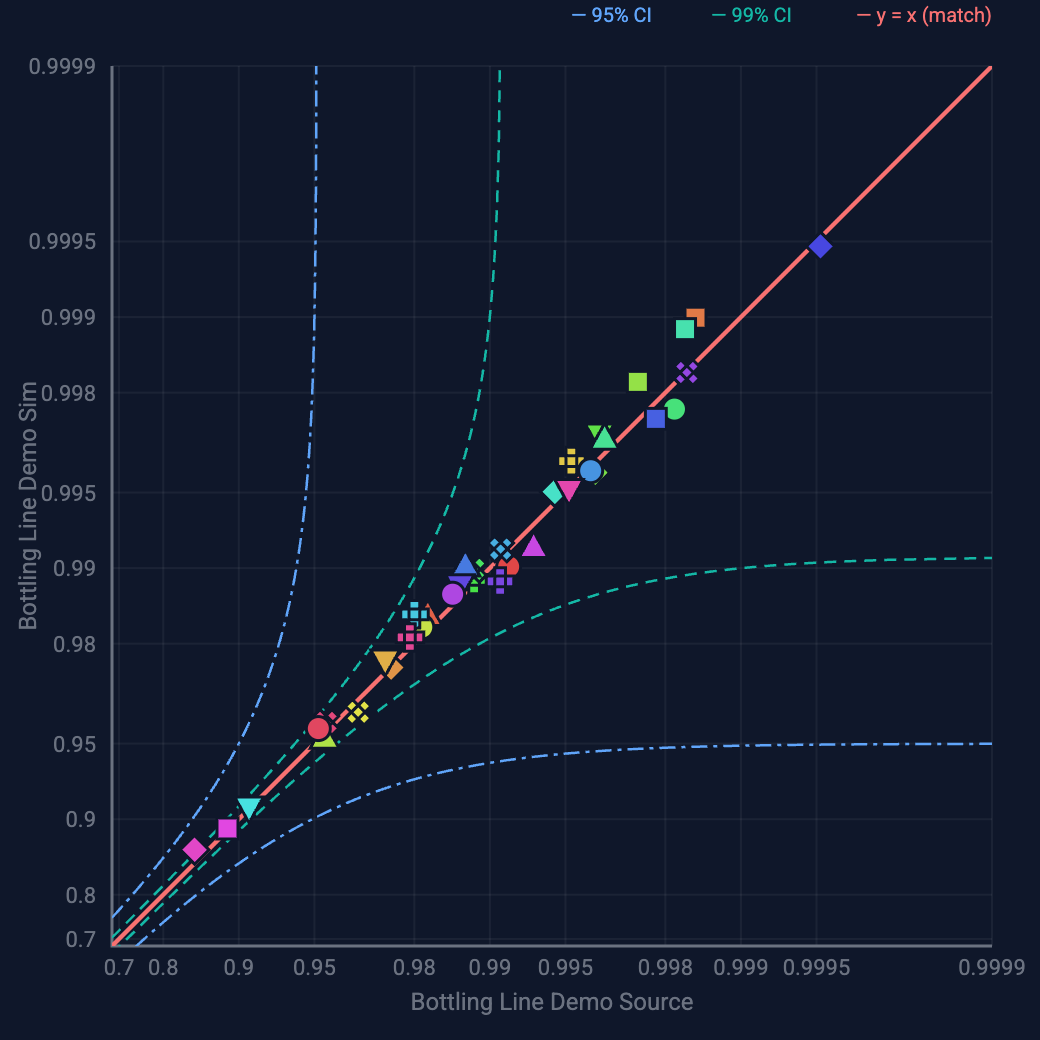
The catch most teams hit: a simulation is only worth acting on if it matches reality. A model that predicts numbers nobody validated is just a more elaborate guess. The standard worth holding to is a model validated against your actual production data — close enough that you'd bet a capital decision on it. (ReliaSim's models are independently validated within ~1% OEE accuracy for exactly this reason.)
The short version
- The biggest WIP pile shows you where flow breaks, not why — look upstream and downstream for the cause.
- The true constraint is the station that's never starved and never blocked.
- Read buffers as pressure gauges: chronically full → constraint downstream; chronically empty → constraint upstream.
- Use effective rate under real failure behavior, never nameplate rate.
- Averages can't see the loss — variability and coupling are where throughput dies.
- Validate the model against real data before you act on it.
Start free in the browser
The fastest way to build the intuition above is to watch it happen. The ReliaSim Sandbox runs curated production-line models right in your browser — change a station's failure behavior, rerun, and see where throughput breaks. No signup. When you're ready to model your own line, that's the full version.
Try the Sandbox → See pricing