How Big Should a Buffer Be?
We Ran Every Combination on One Bottling Line.
Most buffer sizes start as a guess. We took the bottling line that ships with ReliaSim®, sized its three buffers together in every combination, and ran each one for 90 days. That is a full design of experiments: eleven sizes for each buffer, 1,331 runs at each scale. We call it the Buffer Sizing Experiment. Here is what it showed, and how we can run the same study on your line.
The request usually arrives already sized: "we want a bigger accumulator after the capper." The number is rarely checked, and a wrong buffer costs money in both directions. Too small and the line still stalls. Too big and you pay for floor space and product sitting still, for gains the line can't deliver.
Every result on this page is a ReliaSim run of one model. The runner reproduces the ReliaSim Player desktop app run for run, so you can open the same model and get the same numbers.
One stop stops the whole line
The model is the demo bottling line. It runs on failure data at the level of named failure modes, 36 of them, over 90 days.
The Capper runs 100 bottles a minute, and the line is balanced to that rate. The Case Packer makes 10 cases a minute and the Palletizer makes 1 pallet a minute. Buffers 1 and 2 hold bottles. Buffer 3 holds cases.
With no buffers, the line runs at 54.26% efficiency and makes 70,320.87 pallets in 90 days. Efficiency here is pallets made divided by 129,600, the same figure the ReliaSim Player shows.
Here is why it's that low. At 18:09:56 in the run, the Capper's glue station goes down. In the same second the Labeler, Case Packer and Palletizer run out of bottles, and the Filler stops too. The stop lasts 4.2 minutes, and the whole line waits the whole time. Nothing sits between the machines, so every machine's stops become every other machine's stops.
A buffer keeps the next machine running while the one before it is down. It adds no speed and removes no failures.
Size a buffer in minutes, not units
A buffer is worth the time it can keep the next machine running. So the useful unit is minutes of line output. On this line, 100 bottles or 10 cases is one minute.
Buffer size in line time
That rules some sizes out fast. A 10-bottle buffer after the Capper holds 6 seconds. Against a 4.2-minute stop it does almost nothing. Over 90 days it moved the line by well under a point: 69,875.79 pallets, against 70,320.87 with no buffer at all.
Convert every candidate to minutes before you compare them. A 500-bottle table and a 50-case accumulator look nothing alike on a drawing. On this line both hold 5 minutes.
Where it goes matters as much as how big
First, each buffer on its own, from 0 to 500, with the other two at zero.
- Buffer 1, after the Capper, reaches 63.65% at 500 bottles.
- Buffer 2, after the Labeler, reaches 60.90% at 500 bottles.
- Buffer 3, before the Palletizer, reaches 63.39% at 500 cases.
Loading the runs…
One buffer at a time, efficiency %
| Buffer size | 0 | 50 | 100 | 250 | 500 |
|---|---|---|---|---|---|
| Buffer 1 (bottles) | 54.26 | 55.83 | 57.13 | 60.54 | 63.65 |
| Buffer 2 (bottles) | 54.26 | 55.42 | 56.54 | 58.74 | 60.90 |
| Buffer 3 (cases) | 54.26 | 59.93 | 61.64 | 63.03 | 63.39 |
Buffer 3 climbs fastest. It reaches 61.64% by 100 cases and then flattens. Buffers 1 and 2 are still climbing at 500 bottles.
Now compare them at the same number of minutes. At 5 minutes each, Buffer 1 (500 bottles) gives 63.65%, Buffer 2 (500 bottles) gives 60.90% and Buffer 3 (50 cases) gives 59.93%. Same time, three different results, because each position sits between a different set of stops.
Buffers overlap, so their gains don't add up
The next question is what happens with two or three at once. The easy mistake is to add up the one-at-a-time gains.
- Buffer 1 at 500 adds 9.39 points on its own. With Buffer 3 already at 500, it adds 6.01.
- Buffer 2 at 500 adds 6.64 points on its own. With Buffer 1 already at 500, it adds 3.09.
Much of the time one buffer wins back, another buffer wins back too. Once a stop is covered, a second buffer can't cover it again. So each buffer is worth less when the others are already in place, and a plan built from single-buffer studies will promise more than the line delivers.
Loading the runs…
Read the map along a row and you see Buffer 1's gain at a fixed Buffer 3. Read it up a column and you see Buffer 3's. Both flatten as the other one grows.
There's a ceiling, and a realistic maximum below it
How far can buffers take this line? We ran them effectively unlimited: 100,000 bottles, 100,000 bottles and 10,000 cases. The line reached 71.72%, 92,949.53 pallets. At 5,000, 5,000 and 1,000 it made exactly the same. Past that point more storage buys nothing. Each machine's own stops cap the line.
Nobody builds that much storage. On this site we use 5 minutes per buffer as the realistic maximum: 500 bottles, 500 bottles and 50 cases. That gives 68.20%, 88,385.12 pallets, the best combination inside that limit.
Three reference points
Everything above 71.72% belongs to the machines themselves, and only fixing the failure modes reaches it.
What this says about Lean and Theory of Constraints
Lean treats inventory as waste. Work-in-process ties up cash, hides defects and lets a broken process keep running without anyone noticing. Theory of Constraints protects one spot on purpose, because an hour lost at the constraint is an hour lost for the whole plant. Factory Physics adds the rule underneath both: variability gets buffered by inventory, by capacity or by time, and you only choose which.
This line shows both sides. Buffers took it from 54.26% to 68.20% inside the 5-minute limit. That's the case for buffers. They also stop at 71.72% however big they get. After that the only lever left is the stops themselves, which is Lean's point. Which side matters more on your line depends on your stops, and that's measurable.
What a buffer costs
The model tells you what each size buys. The cost comes from the plant, and in food and beverage it's more than a rack and some floor.
- Shelf life runs while product waits. Work-in-process is product spending its dating in your building instead of on a shelf.
- Sanitation grows with what holds product. Every accumulator and surge table is a surface to break down, clean and verify, and that time comes out of the same window the buffer was meant to protect.
- Changeovers get bigger. Product in the line at a changeover has to be run out, held or thrown away.
- Recall scope follows work-in-process. The more product in the system when a problem is found, the bigger the window to account for.
- Cold space is expensive space. If the buffer has to be refrigerated, "where space is available" means "where you'll build more cold storage."
A generous buffer can also hide the failure it absorbs. The line runs well enough, the root cause never gets attention, and the buffer becomes permanent.
Why you can now afford to sweep
“I’ve never seen anything like this.”
VP of Food Production
“This is so cool.”
Food production employees
Buffer sizes get guessed because sweeping them used to be expensive. When every candidate costs an overnight run, you pick three. The published validation model was rebuilt in ReliaSim and independently validated within 1% of measured OEE. On the same laptop and the same one-year simulation, the original ran about 1200× slower than the ReliaSim rebuild.
Below is a buffer sweep on the Buffer-Options model, the bottling line with inline buffers. It's one of the demo models that ships with the trial and the full version. The sweep crosses every capacity from 0 to 100 with every interrupt, at ten replications and a 90-day horizon. You can open the same model in the browser sandbox.
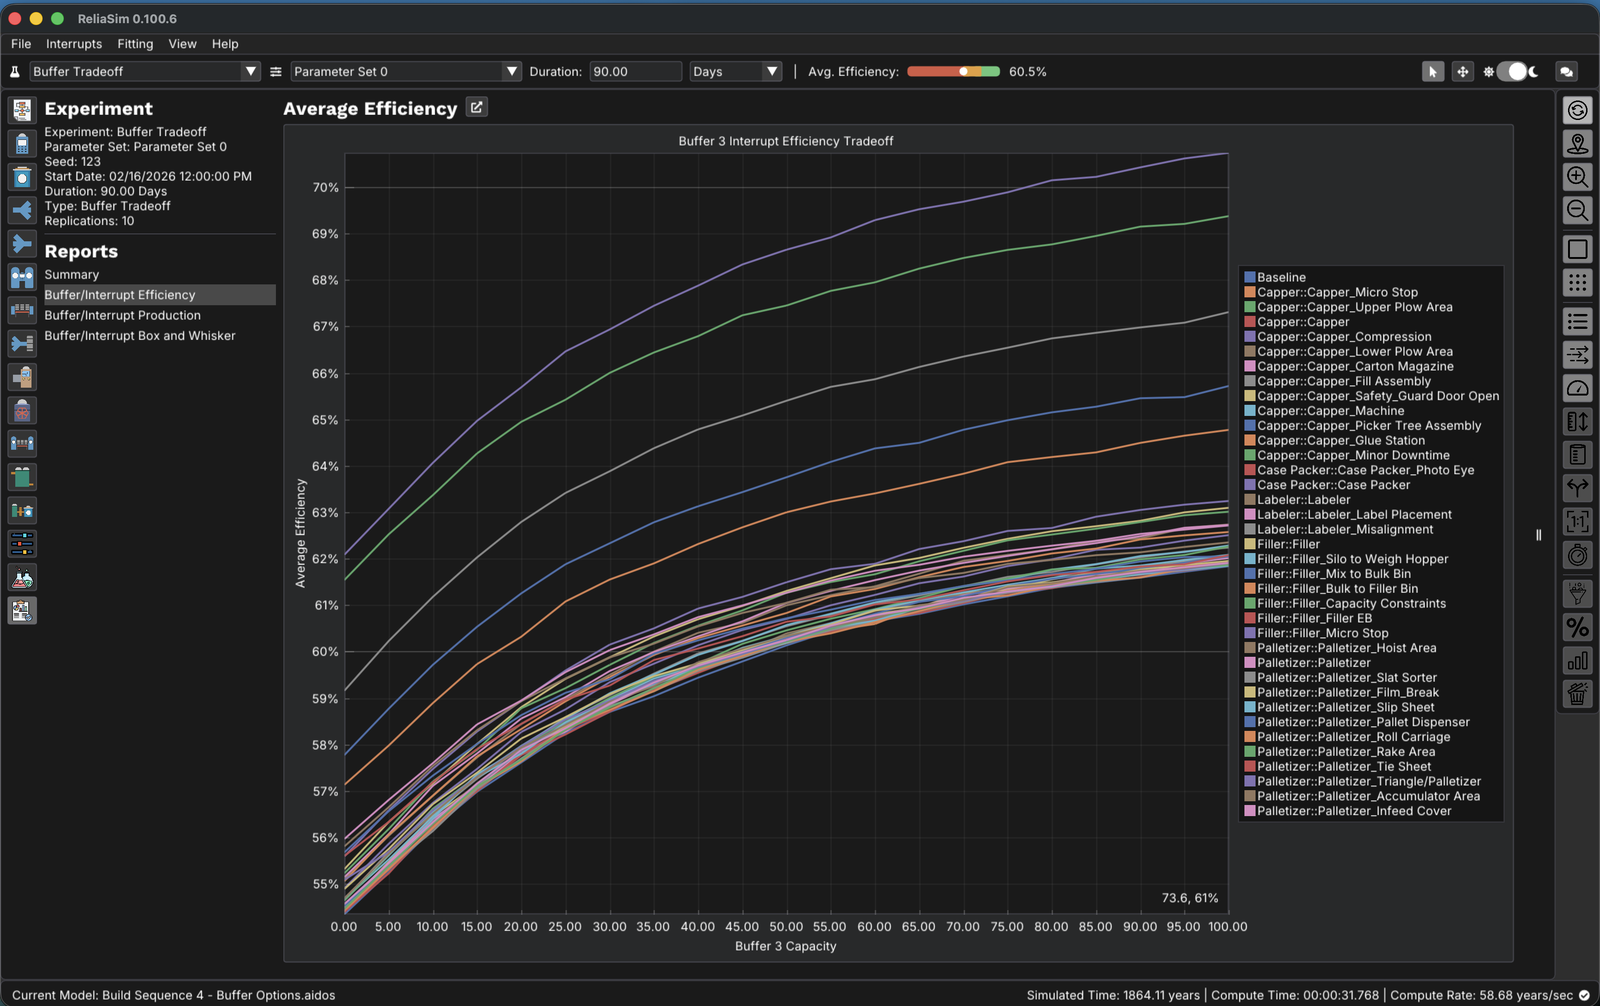
What that sweep cost
| Measure | Value |
|---|---|
| Runs in the sweep | 7,770 |
| Wall-clock time | 31.8 seconds |
| Simulated time covered | 1,864 years |
| Rate | 58.68 simulated years / sec |

Watch the sweep run
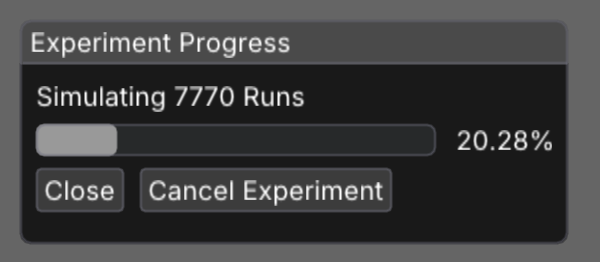
Here's the same Buffer Tradeoff experiment on the Buffer-Options model, recorded unedited on a laptop at a one-year horizon instead of 90 days. It covered 2,160 simulated years in 31.6 seconds, or 68.32 simulated years per second.
Take the timing as one measurement, not a specification. It moves with the model, the machine and the run length. What generalizes is that you can bring the curve to the meeting instead of three candidates.
Run it on your line
We can run this study on your line. Send your stop data and where storage could go. Start with a free line assessment.
You can try this on the demo line now. The buffer explorer in the Sandbox lets you move all three buffers across every run in this study. The Buffer Options model in the Sandbox is the same line.
Part of the science of continuous improvement. The Buffer Sizing Experiment sits beside Gain/Loss (what to fix first) and the Improvement Roadmap (which fixes, in what order, to reach a target). On the demo line, adding 100 cases before the Palletizer as the roadmap’s second step passes 85% in five steps instead of seven fixes, and reaches 88.9% in seven. See all three →
Try it on a real bottling line: the Sandbox question Where should the buffer go, and how big?, or one move in Beat the Bottleneck.
Try the sizes before you buy the storage
Move all three buffers across every run in this study and watch where the gains overlap and where the ceiling sits.
Explore the buffer runs → Open the Buffer Options modelWant this run on your own line? Start with a free line assessment.