The Constraint Everyone Could See
Was Not the One Costing Them Throughput
An olive plant knew where its bottleneck was. The pitting machines took two hours to change over between olive sizes — visible, expensive, and obviously decisive. A capacity model built to size capital against rising volume found the real limits somewhere else entirely, and a scheduling change recovered 15% more throughput without new equipment.
The plant
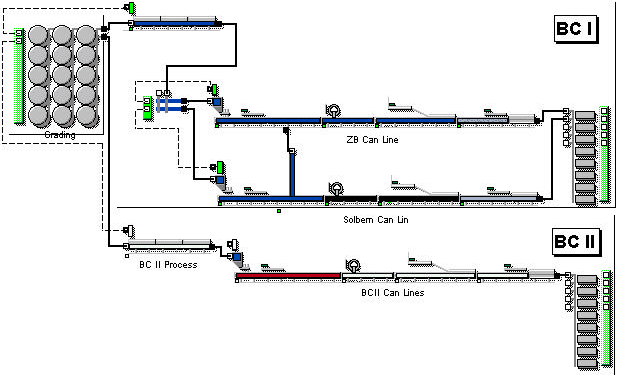
Bell-Carter Foods is an olive copacker. The facility is large and its flow is genuinely complex: olives arrive on a harvest cycle nobody controls, are graded and pitted, filled into cans, retorted, and then packaged. Volume was rising and the company needed to know what to buy, and when.
The obvious answer
Every plant has a machine that looks like the constraint, and this one had a good candidate. A changeover between olive sizes on the pitting machines takes about two hours. Long, frequent, visible changeovers make a machine look decisive — and on a loss report, they are the biggest single line item.
This is the trap the rest of these guides describe from the other direction. A machine that stops often and stops long dominates the ranking by minutes lost. Whether the line actually noticed is a different question, and only the second one justifies capital.
What the model found instead
The capacity model tracked material through the whole plant rather than auditing machines one at a time. The pitting changeovers were real, but they were not where throughput was being lost. The binding constraints sat downstream — in packaging, after the olives had already been filled and retorted.
“There are many other choke points, particularly in packaging after olives have been filled in cans and retorted — and they’re not in the places you would expect them to be.”— Robert Rugeroni, MIS director, Bell-Carter Foods, in Food Engineering
That phrase — not in the places you would expect them to be — is the whole finding. The plant had competent people who knew their process. The constraint was not hidden because anyone was careless; it was hidden because a downstream choke point does not announce itself. It shows up as a machine upstream appearing busy.
What it was worth
Outcome
| Change | Result |
|---|---|
| Theory-of-Constraints daily scheduling no new equipment | 15% throughput improvement |
| Proposed capital expenditure | evaluated against the model before committing |
| Harvest variability | quantified rather than absorbed as buffer |
The scheduling system that produced it was Theory-of-Constraints based and run daily. The model’s second job was arguably worth as much: proposed capital could be tested against it before the money was committed, over both short and long horizons.
“The model confirmed bottlenecks at certain operations in the plant … an effective tool to evaluate proposed capital expenditures and scheduling changes over short and long-term periods.”— Robert Rugeroni, Bell-Carter Foods
Why this one is on the record
This work predates ReliaSim as a product. It was done by the same team using the rate-based modelling approach that ReliaSim now packages — the same discrete-rate method, the same treatment of flow, variability and downstream coupling. We are not claiming the software in the sandbox produced these numbers. We are claiming the method behind them has been in production use for more than three decades — and that it now ships in a package fast enough to run a thousand one-year simulations in about thirty seconds.
It is also published. The method and results were written up as Capacity Planning Simulation of an Olive Processing Plant (PDF), so the claim can be checked rather than taken on trust.
The transferable part. The pitting machines were not a red herring — they were genuinely the longest single downtime on the report. They simply were not the throughput constraint. Any plant ranking improvement projects by minutes lost will make this mistake, and the only reliable way to catch it is to re-run the line with the loss removed and see what actually comes back.
Related: The Hidden Bottleneck · Which Loss to Fix First · How a bottling line found $1.5M · All guides