Micro-Stops vs Breakdowns
Why the Short Ones Cost More
A breakdown gets a work order, a root-cause meeting and a line on the downtime Pareto. A one-minute jam gets cleared by the operator and forgotten. Put the two side by side with the same recorded loss, and the frequent short stops can take more throughput off the line than the rare long one. Here is why, and how to tell which you have.
Micro-stops, minor stops and speed loss
In the Six Big Losses, equipment failure is an Availability loss and minor stops and reduced speed are Performance losses. The split matters more than it looks. A breakdown is logged as a stop with a start, an end and usually a cause. A micro-stop, a jam cleared in under a minute or a sensor fault reset at the panel, often falls below whatever threshold the plant’s system uses to record a stop. It shows up only as a machine that made fewer units than its run time allowed.
So micro-stops hide in performance loss. They get recorded as speed loss, which reads like a machine running a little slow, not one stopping a hundred times a shift. Nobody writes a work order for speed loss. That is the first reason they get ranked too low: the data doesn’t show them as events at all.
The second reason is structural, and it applies even when every stop is logged perfectly.
The ranking a loss report gives you
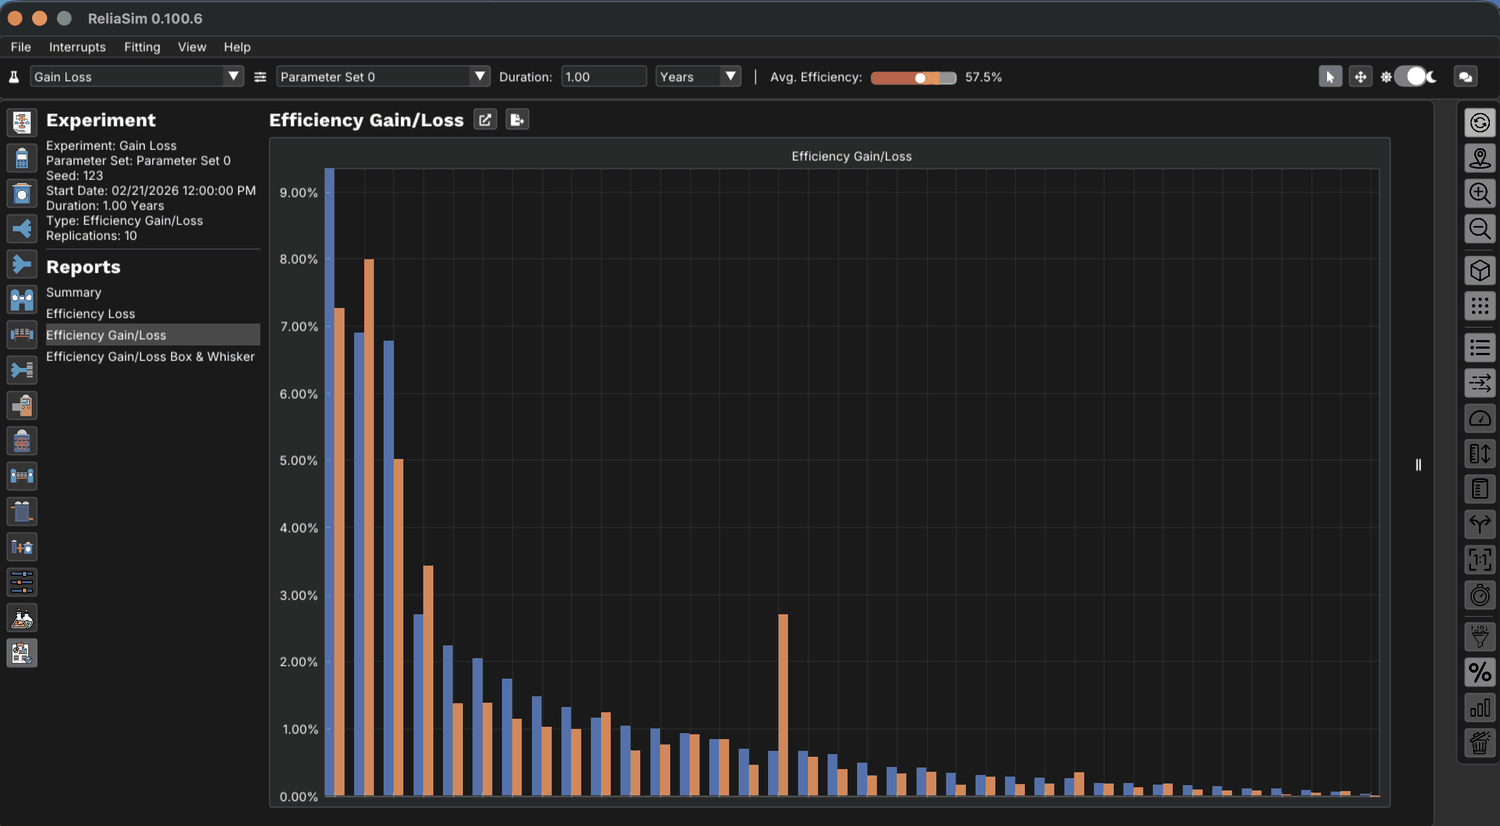
In our bottling line case study, a five-machine line (Filler, Capper, Labeler, Case Packer, Palletizer) had two failure modes with nearly equal direct losses. Labeler Misalignment was infrequent, longer stops at 6.79% direct efficiency loss. Filler Micro Stop was frequent, short stops at 6.72%. On a Pareto they rank level, and most improvement teams would pick the Labeler, because it is the bigger single event and easier to see.
What removing each one gives back
A loss report can tell you what each failure mode cost. It can’t tell you what comes back when you remove it. For that you remove one failure mode in a validated model, re-run the whole line, and measure the recovered output. ReliaSim’s methodology page shows the pair:
Loss vs gain, same line
| Failure mode | Pattern | Loss | Gain when removed | Gain ÷ loss |
|---|---|---|---|---|
| Labeler Misalignment | rare, longer stops | 6.78% | 5.10% | 0.75× |
| Filler Micro Stop | frequent, short stops | 6.67% | 7.97% | 1.2× |
The case study reports the same comparison at 1.21× and 0.73×. The losses are almost identical and the recoveries are not. Removing the Labeler’s long stops returns less than they appeared to cost, because the line was already absorbing part of them. Removing the Filler’s micro-stops returns more than they appeared to cost: the case study describes 120 one-minute micro stops whose effects landed as idle time on the Labeler, Case Packer and Palletizer, never under the Filler’s own name.
Why frequent short stops can cost more
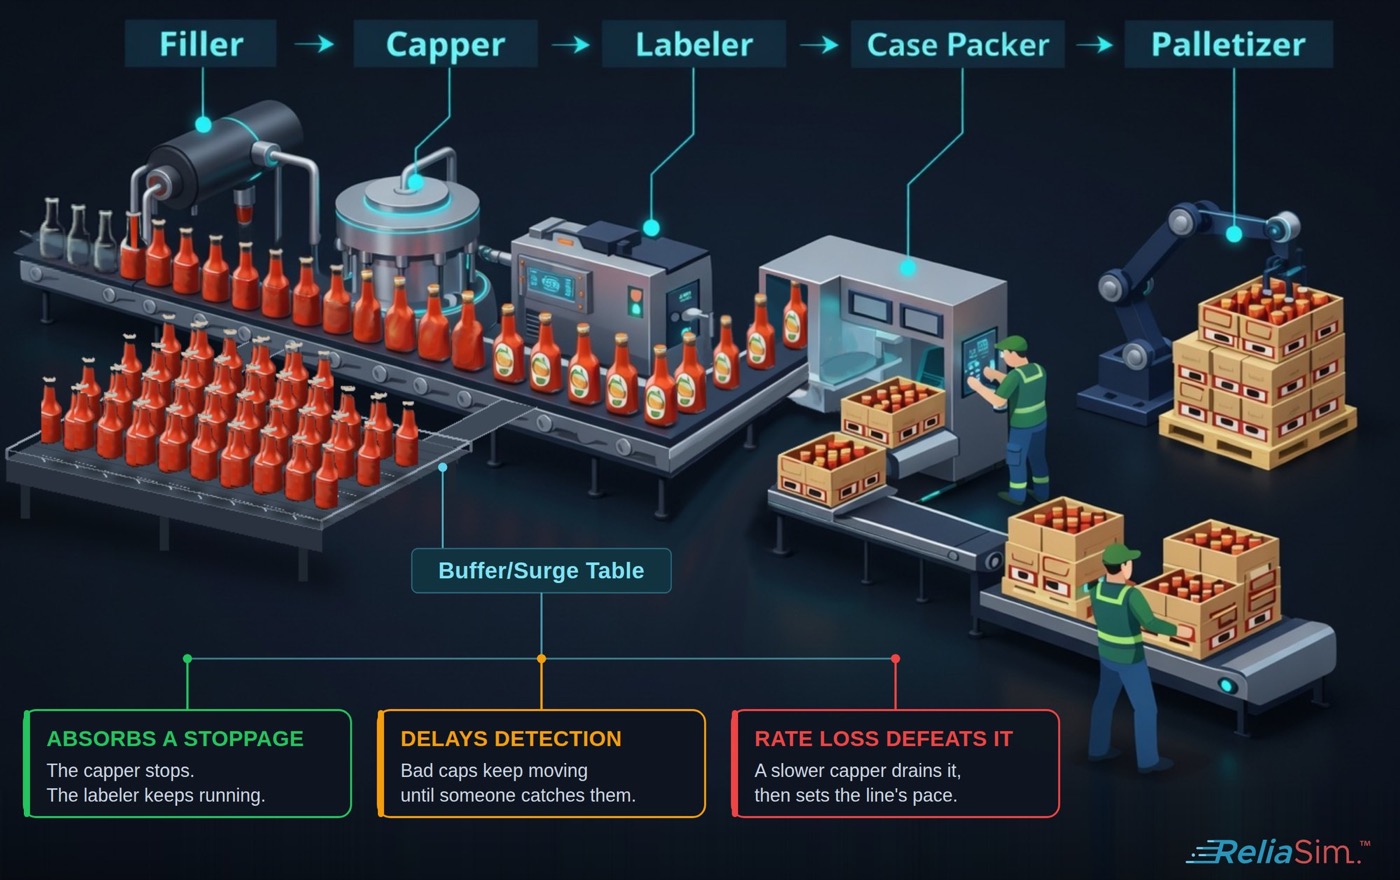
A buffer absorbs a stop only if it has stock when the stop begins. That condition explains most of the gap, and it is exactly what frequency attacks.
1. They never let the buffer refill
A buffer refills only as fast as the machine feeding it can outrun the machine it feeds. On a high-speed line where every machine is rated near the same speed, that margin is small, so refilling is slow. Short stops that arrive faster than the buffer refills drain it step by step.
Illustrative arithmetic, not plant data
An upstream machine can run at 66 units per minute. The machine after the buffer draws 60, so the buffer refills at 6 a minute while both run. A one-minute upstream stop drains 60 units, which takes 10 minutes to put back. If a one-minute stop comes every five minutes, the buffer regains 24 units between stops and loses 60 in each. It falls by 36 units per cycle, so a 240-unit buffer is nearly empty after half an hour. From then on it holds about 24 seconds of stock when a stop begins.
2. They take the buffer away from every other stop
This is why gain can exceed loss. Once short stops have drained a buffer, it can’t protect against anything else either: a stop on the machine feeding it, a longer jam, a changeover overrun. Those losses pass straight through and get charged to other failure modes. Remove the micro-stops, and the buffer is full again for all of them. That recovered protection is the part of the gain the loss report never showed.
3. They cascade on close-coupled sections
Where there is little or no storage between machines, every micro-stop stops the neighbors too: the machine after it starves, and the machine before it blocks. On a report the neighbors show idle time, not downtime, so the cost is spread across machines that did nothing wrong. Our packaging industry page calls this the single most common misranking on a CPG loss tree: a stoppage measured in seconds that never lets buffers refill, so its cost is carried continuously rather than occasionally (Packaging & CPG). Takted electronics and automotive lines with minimal inventory behave the same way (Electronics & Automotive).
Why long stops still matter
None of this means micro-stops always outrank breakdowns. A long stop outlasts any practical buffer: covering a 40-minute failure at 60 units a minute takes 2,400 units of storage, and nobody builds that (How big should a buffer be?). On the Buffer-Options demo line, the dominant loss is a long stoppage on the constraint itself, and removing it beats adding storage at every buffer size.
What decides it on a given line is how stop lengths compare with buffer size, how quickly buffers refill, and where each machine sits relative to the constraint. Two machines can come out with the same MTBF, MTTR and availability and still affect the line differently, because one’s stops are all short and the other’s include a few very long ones. That is why a line model takes time-to-failure and time-to-repair distributions per failure mode, and MTBF, MTTR and availability are results it reports rather than numbers it runs on: MTBF and MTTR are outputs, not inputs.
Speed loss is not the same as a stop
Reduced speed also lands in Performance, and it has its own interaction with buffers. A machine running slower than the one before it fills the buffer between them and then blocks the faster machine. A machine running slower than the one after it drains the buffer and then sets the pace of everything downstream. Either way, a slow machine defeats the buffer beside it, just as frequent stops do.
Where the slow machine sits decides what it costs. Speed loss on the constraint costs output directly. Speed loss on a machine with plenty of spare rate may cost nothing at all. The OEE report charges both the same Performance points.
How to rank short and long stops on your line
- Log short stops as stops. Record them by cause, not as a lower rate. A micro-stop you can’t see as an event can’t be modeled or ranked.
- Fit distributions per cause. Time-to-failure and time-to-repair for each failure mode, not a pooled average per machine. Downtime data analysis in ReliaStats does this from line event data.
- Validate before you rank. A model built from per-failure-mode interrupt data, fitted properly and checked against line history, can match measured OEE within 1%. The published Fischel & Lange (WSC 2020) model, rebuilt in ReliaSim and independently validated by Tom Lange, is the public proof point (Within 1% of measured OEE).
- Rank by gain, not loss. Remove each failure mode in turn and read what comes back. Which loss to fix first covers the method.
The case study’s outcome is the reason to bother. Following the Pareto points the budget at alignment tooling for the Labeler. Following the model points it at the Filler’s jams, which recover 62% more throughput.
Frequently asked questions
What is a micro stop?
A very short stoppage, such as a jam cleared by the operator or a fault reset at the panel, often too short to be logged as downtime. In OEE, minor stops are a Performance loss, so they tend to appear as a machine running slightly slow rather than as stop events.
Are minor stops part of availability or performance in OEE?
Performance. The Six Big Losses put equipment failure and setup under Availability, and minor stops and reduced speed under Performance. That is one reason micro-stops are underestimated: they are recorded as speed loss, not as stops with causes.
Why can micro stops cost more than breakdowns?
Frequent short stops keep buffers from refilling, so the buffers are empty when the next stop arrives, whether it is another micro-stop or a different failure. On close-coupled sections each one also starves and blocks the neighboring machines. Removing them can return more output than their recorded loss.
What is speed loss?
Running below the rated or ideal rate. It is a Performance loss in OEE. On a line, a slow machine drains or fills the buffer beside it and then sets the pace, so its cost depends on whether it is at or near the constraint.
Do breakdowns still matter more sometimes?
Yes. A long stop outlasts any practical buffer, and on some lines the dominant loss is a long stoppage on the constraint. Which matters more depends on stop lengths against buffer size, refill rate and where each machine sits, and a loss/gain experiment on a validated model settles it.
How do you find out which stops to fix first?
Log short stops by cause, fit time-to-failure and time-to-repair distributions per failure mode, validate a line model against measured OEE, then remove each failure mode in turn and rank by the output that comes back.
Watch short stops drain a buffer
The ReliaSim Sandbox runs a bottling line in your browser. Change a buffer, drop an interrupt, and see what actually comes back. No signup.
Open the sandbox → Read the case studyWant to talk it through for your line? Schedule a call.