The Improvement Roadmap
Which Fixes, in What Order, to Reach Your Target
Every plant has a list of improvement projects. The hard part is the order: which fix first, which next, and how many it takes to hit the target. An improvement roadmap answers that with experiments in a model instead of judgment, and on our demo bottling line it reaches 85% in seven fixes where 2,000 random plans never get there.
Why the order is hard to guess
Our demo bottling line has five machines and 36 failure modes. There are about 8.3 million ways to choose seven of them to fix, and about 42 billion ways to choose seven in order. Nobody ranks that by hand.
The usual shortcut is the downtime report: fix whatever lost the most minutes. But a line isn’t a list of machines. A stop on one machine can be absorbed by storage, or hidden behind a bigger stop next door, so the minutes a failure costs and the output a fix gives back are different numbers. We cover that in which loss to fix first. Once one fix is in, the ranking of everything else changes, which is why a single ranking isn’t a plan.
How the roadmap is built
- Try every fix. In the model, take each failure mode off the line in turn and run it. Here every run is 90 days, averaged over ten seeds.
- Keep the one that gives back the most. That is the 1st fix.
- Repeat on the improved line. With the 1st fix in, try each remaining failure mode again and keep the best. That is the 2nd fix. Stop when the line reaches the target.
On the demo line that is 231 sets of runs: 36 options at the 1st step, 35 at the 2nd, down to 30 at the 7th.
The roadmap for the demo bottling line
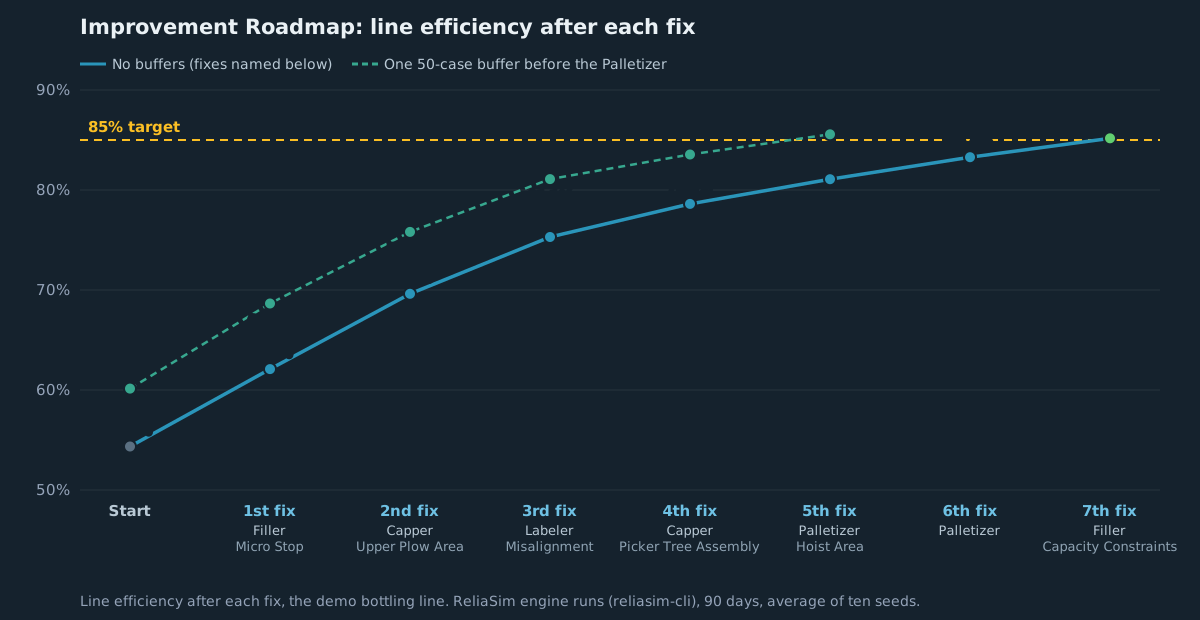
Improvement Roadmap · no buffers
| Step | Fix | Line efficiency | Pallets back in 90 days |
|---|---|---|---|
| Start | The line as it is | 54.3% | – |
| 1st fix | Filler: Micro Stop | 62.1% | +10,034 |
| 2nd fix | Capper: Upper Plow Area | 69.6% | +9,762 |
| 3rd fix | Labeler: Misalignment | 75.3% | +7,366 |
| 4th fix | Capper: Picker Tree Assembly | 78.6% | +4,279 |
| 5th fix | Palletizer: Hoist Area | 81.1% | +3,204 |
| 6th fix | Palletizer | 83.3% | +2,851 |
| 7th fix | Filler: Capacity Constraints | 85.2% | +2,456 |
- Each fix gives back less than the one before. The 1st is worth about 10,000 pallets over 90 days; the 7th, about 2,500. Budget for the whole roadmap, not the first step.
- One small buffer in the right place does the work of two fixes. With 50 cases of storage before the Palletizer the line starts at 60.1% and reaches 85% in five fixes instead of seven. Where to put storage, and how much, is its own experiment: see the Buffer Sizing Experiment.
Is it the optimal roadmap?
Picking the best next fix each time doesn’t guarantee the best seven overall, so we checked it four ways, all in the engine:
- A wider search. Keeping the best 25 plans at every step, instead of one, finds the same seven fixes.
- Every swap. Replacing any one of the seven with any other failure mode (203 plans) does no better.
- Every order. Of all 5,040 orders of the seven fixes, the roadmap’s climbs fastest.
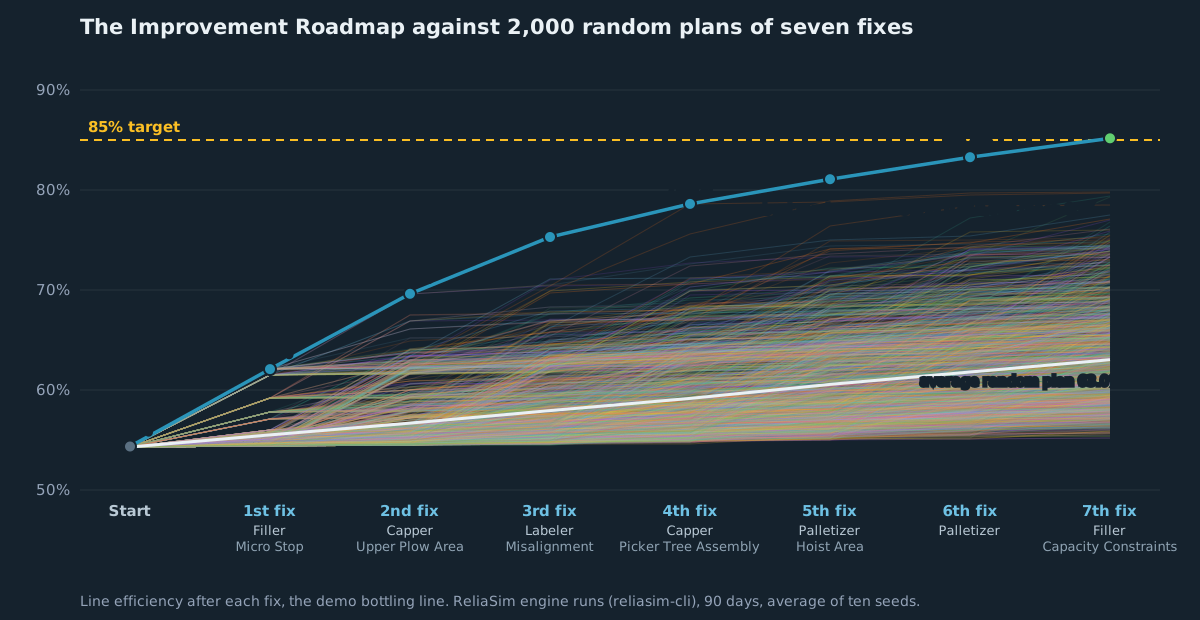
- Random plans. Of 2,000 plans of seven fixes picked at random, none reaches 85%. The best gets to 79.8%; the average, 63.0%.
The order matters as much as the fixes
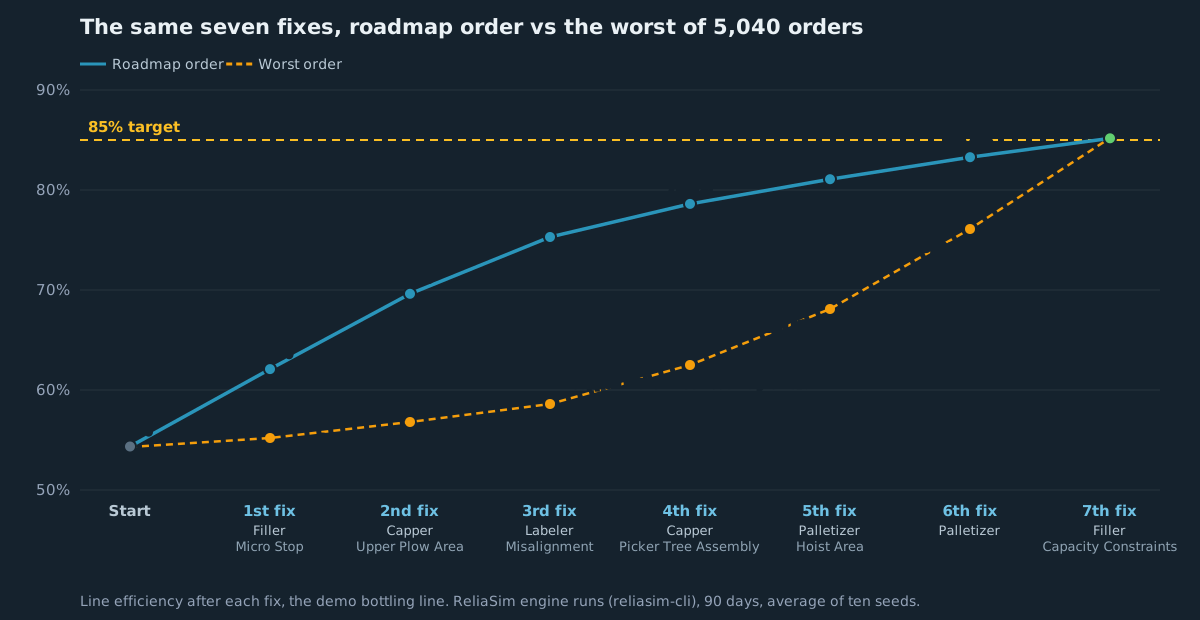
The same seven fixes end at the same place in any order: which fixes you make decides where the line ends up. The order decides how fast it gets there, and so how much you produce along the way. In the worst order, the line is at 62.5% after four fixes. On the roadmap it is at 78.6%.
How to build one for your line
- Stop data by failure mode. How often each failure happens and how long it lasts. ReliaStats® fits those patterns from your line’s event data.
- A model that matches the line. Before you trust its roadmap, the model should reproduce the output the line actually makes. The method covers that step.
- Realistic fixes. In this demo a fix removes a failure mode entirely. On the floor a fix usually cuts a failure in half or shortens the repair, so model it that way. The roadmap gets more, smaller steps; the method is the same.
Part of the science of continuous improvement. The Improvement Roadmap sits beside Gain/Loss (what to fix first) and the Buffer Sizing Experiment (where storage pays). See all three →
Questions
What is an improvement roadmap?
The fixes that take a production line from where it is to a target, in the order to make them. It is built in a simulation model: take each failure mode off the line, run it, keep the fix that gives back the most, and repeat on the improved line until it reaches the target.
How many fixes does it take to reach 85% OEE?
It depends on the line. On our demo bottling line, five machines with 36 failure modes and no buffers, it takes seven fixes to go from 54.3% to 85.2%. With one 50-case buffer before the Palletizer it takes five.
Does the order of improvements matter?
The same set of fixes ends at the same place in any order, but the order decides how fast the line gets there. Of the 5,040 orders of our seven fixes, the worst has the line at 62.5% after four fixes; the roadmap order has it at 78.6%.
Can you just pick improvement projects at random?
Not if you want to reach the target. Of 2,000 plans of seven fixes picked at random on our demo line, none reached 85%. The best got to 79.8%, and the average to 63.0%.
Build the roadmap yourself
The Sandbox has the demo bottling line with every run behind this page. Compare the roadmap with every option at each step, with 2,000 random plans, and with other orders of the same fixes.
Open the Improvement Roadmap → Is 85% OEE achievable?