Growing an Olive Plant’s Output
15% More From Scheduling, Before Buying Equipment
A specialty olive packer expects sales to rise sharply. The whole crop arrives in a six-week harvest, so the plant processes a year of olives out of storage. Managers need to know what the current plant can handle and where capital should go. A simulation of the full plant answers both. Testing scheduling rules in it finds 15% more throughput without new equipment.
- The business
- A specialty olive packer · olive processing and canning
- The question
- What can the current plant handle, and what should we buy?
- The model
- A full harvest year, every olive variety and can size
- What it is worth
- 15% more throughput from scheduling; capital tested before purchase
- Source
- Published paper · trade-press coverage · SDI project record
What the plant is up against
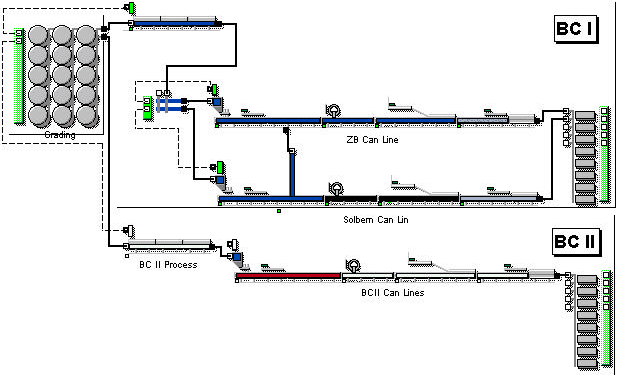
The plant pits, sorts, fills, seams and cooks olives into consumer-size cans. Every olive is harvested in about six weeks, then stored and processed through the rest of the year. That makes inventory and scheduling central to everything downstream.
Each variety pits at its own speed and has its own defects to sort out. A changeover between olive sizes on the pitting machines takes about two hours. Different areas run different shift patterns. With sales forecasts rising, the question is whether the current plant can keep up, and if not, what to buy.
How it is modeled
SDI builds a rate-based model of the plant from the plant’s own data. That covers the capacities of the pitters, continuous cookers and still retorts, yields by variety, shift patterns, routing by variety and can size, and changeover and downtime records. The model runs a full year from the plant’s production schedule and reports the overtime each schedule would need.
Plant engineers and the production scheduler review the logic with the modelers, and the team checks the model against a year of the plant’s historical schedule before using it.
What the model shows
The model confirms the bottlenecks the plant suspects, starting with the pitting machines, and shows which operations have capacity to spare. It also finds other choke points further downstream, in packaging, after the olives are filled into cans and retorted.
“…they’re not in the places you would expect them to be.”— Robert Rugeroni, MIS director, on the plant’s other choke points, in Food Engineering
With the model in hand, the team tests scheduling rules, product mix, buffer sizes, and shift and crewing policies before trying any of them on the floor. It also puts a number on how much harvest variability matters.
What changes
New scheduling rules, tested in the model first, raise throughput 15% without new equipment. The plant then runs a Theory of Constraints-based scheduling system day to day, after verifying it with the model.
The model also sets the plant’s capital spending priorities. It is the place to test proposed spending over short and long horizons before committing the money.
“The model confirmed bottlenecks at certain operations in the plant … an effective tool to evaluate proposed capital expenditures and scheduling changes over short and long-term periods.”— Capacity Planning Simulation of an Olive Processing Plant, Barnes, Phelps & Rugeroni
Built by Simulation Dynamics, the team behind ReliaSim, with the rate-based method ReliaSim is built on · source: Capacity Planning Simulation of an Olive Processing Plant (PDF).
A free line assessment, this fall
Bring one question about your line. We model it on your own data and send back a two-page readout in about five business days.
Apply for a free line assessment →Or explore the Sandbox first, with no sign-up.