Simple supply chain
What happens to stock at each site when demand triples?
A supplier, a plant and a customer. One product is assembled from raw material, two parts per unit, and the network runs through 200 days that include a threefold demand spike.
The question it answers
What does a reorder policy do when demand jumps? An average says stock is fine. A simulation shows the order point being crossed, the order going upstream, the wait while it’s made and shipped, and the stock level at each site through the spike and after it.
What you’ll see
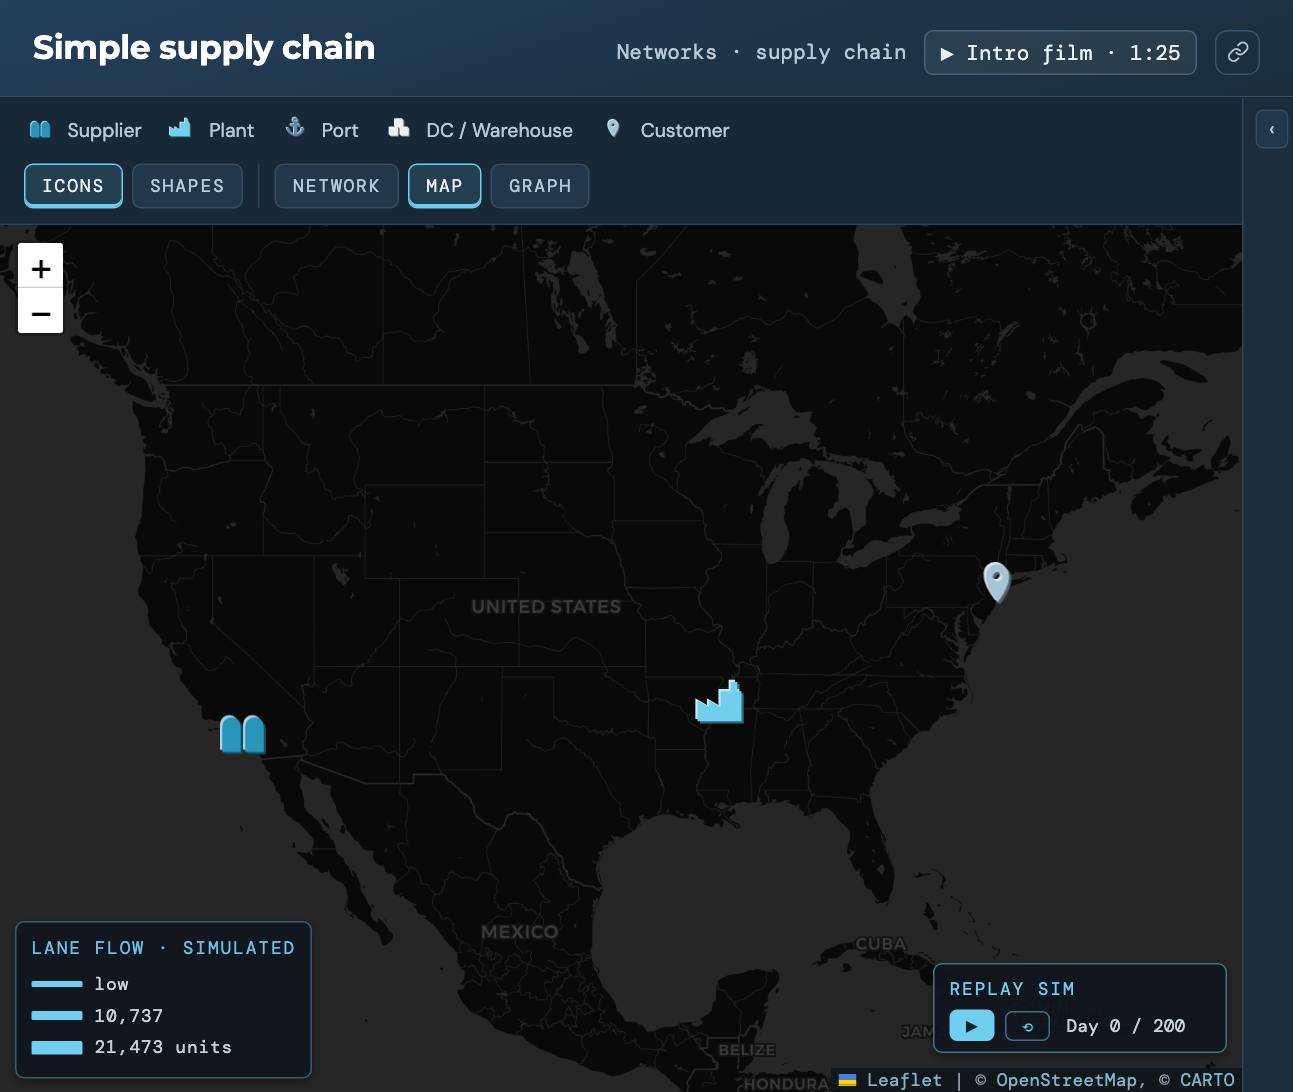
The simulation engine runs when you open the demo. GRAPH shows stock at each location over the 200 days against its order point, so you can see each reorder cycle. MAP plays back every simulated shipment along its lane.
What to change
- Open GRAPH and find where the spike starts and how each site responds.
- Switch to MAP and press replay to watch the shipments.
- Ask the assistant how the reorder cycle works, or what a two-to-one bill of materials means.
Where it leads
This is the smallest network the engine runs. Cookie production runs the same engine on one plant and twelve DCs. Before trusting a run like this on your own data, read how to know your supply chain model is right.
Run Simple supply chain
It opens in the Sandbox with sample data. No signup, no install.
Run it →Or see all eleven network demos.