Cookie production
How does product flow from one plant through twelve DCs?
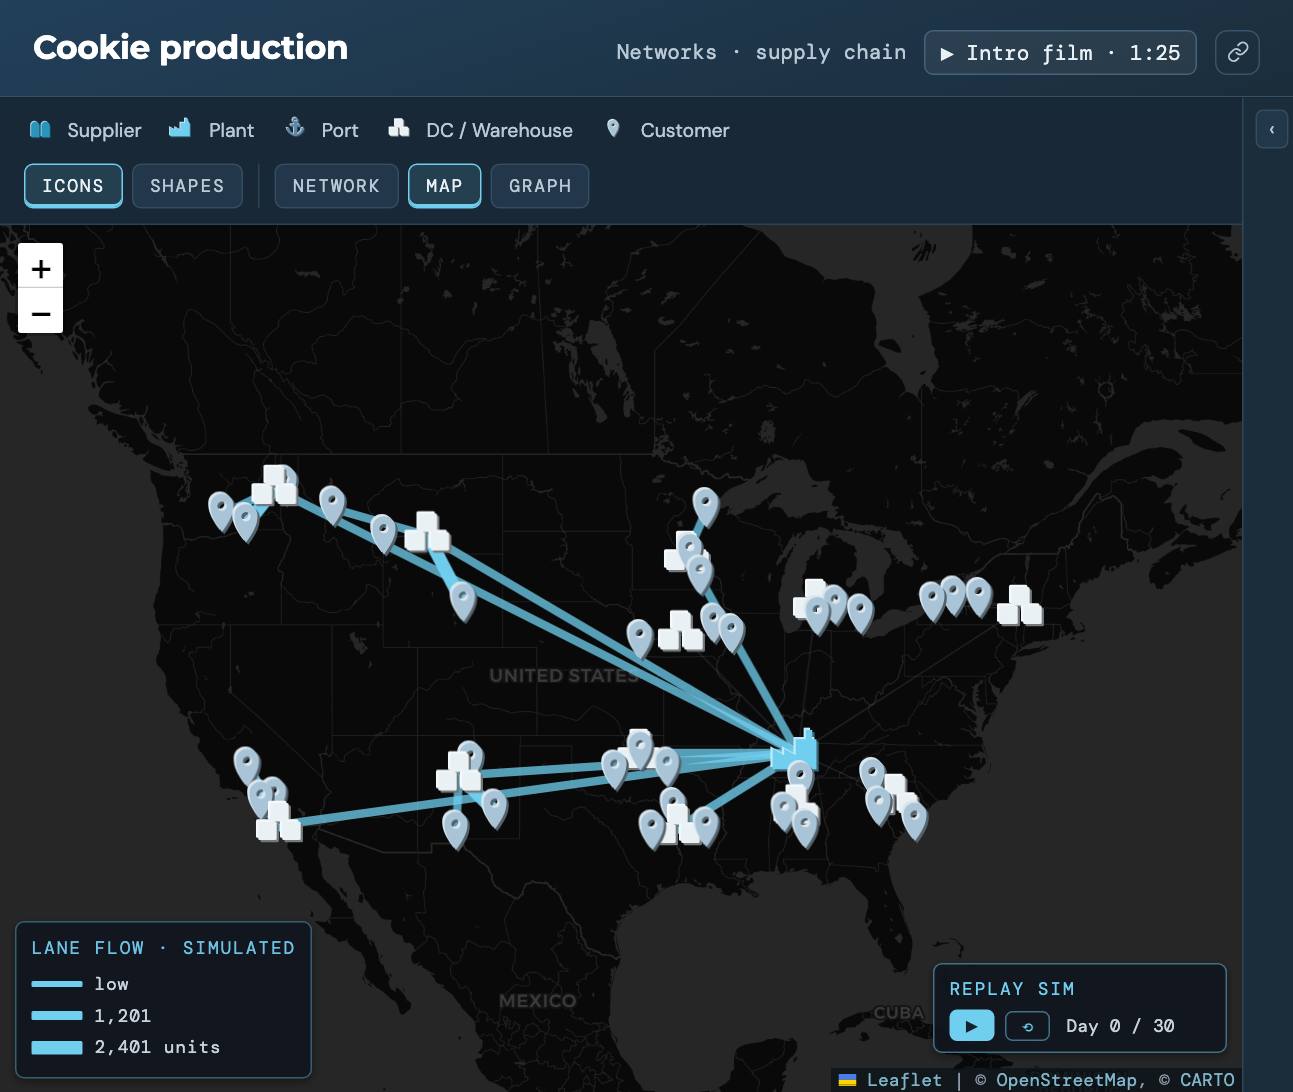
A Nashville plant ships to twelve regional DCs, each serving three customer zones in real US cities, through 30 days of random daily demand.
The question it answers
How does a single-plant network behave day to day? Each customer zone orders a different amount every day, each DC reorders from the plant on its own schedule, and the plant’s shipments have to cover all twelve. The simulation plays that out one event at a time.
What you’ll see
The plant, the DCs and the customer zones on a map of the US, with lanes drawn by how much the run moved along them. Press replay and 30 simulated days of shipments cross the map. Every dot is a shipment from the engine, not an animation. GRAPH shows stock over time by location.
What to change
- Press replay on MAP and watch which DCs draw most from the plant.
- Open GRAPH and compare the stock curves of a busy DC and a quiet one.
- Ask the assistant how you’d test a different DC footprint on this network.
Where it leads
To choose the DC footprint in the first place, start with Greenfield · US. How supply chain simulation works explains what the engine is doing on each day.
Run Cookie production
It opens in the Sandbox with sample data. No signup, no install.
Run it →Or see all eleven network demos.