Greenfield · US
If we started over, where would the DCs go, and how many?
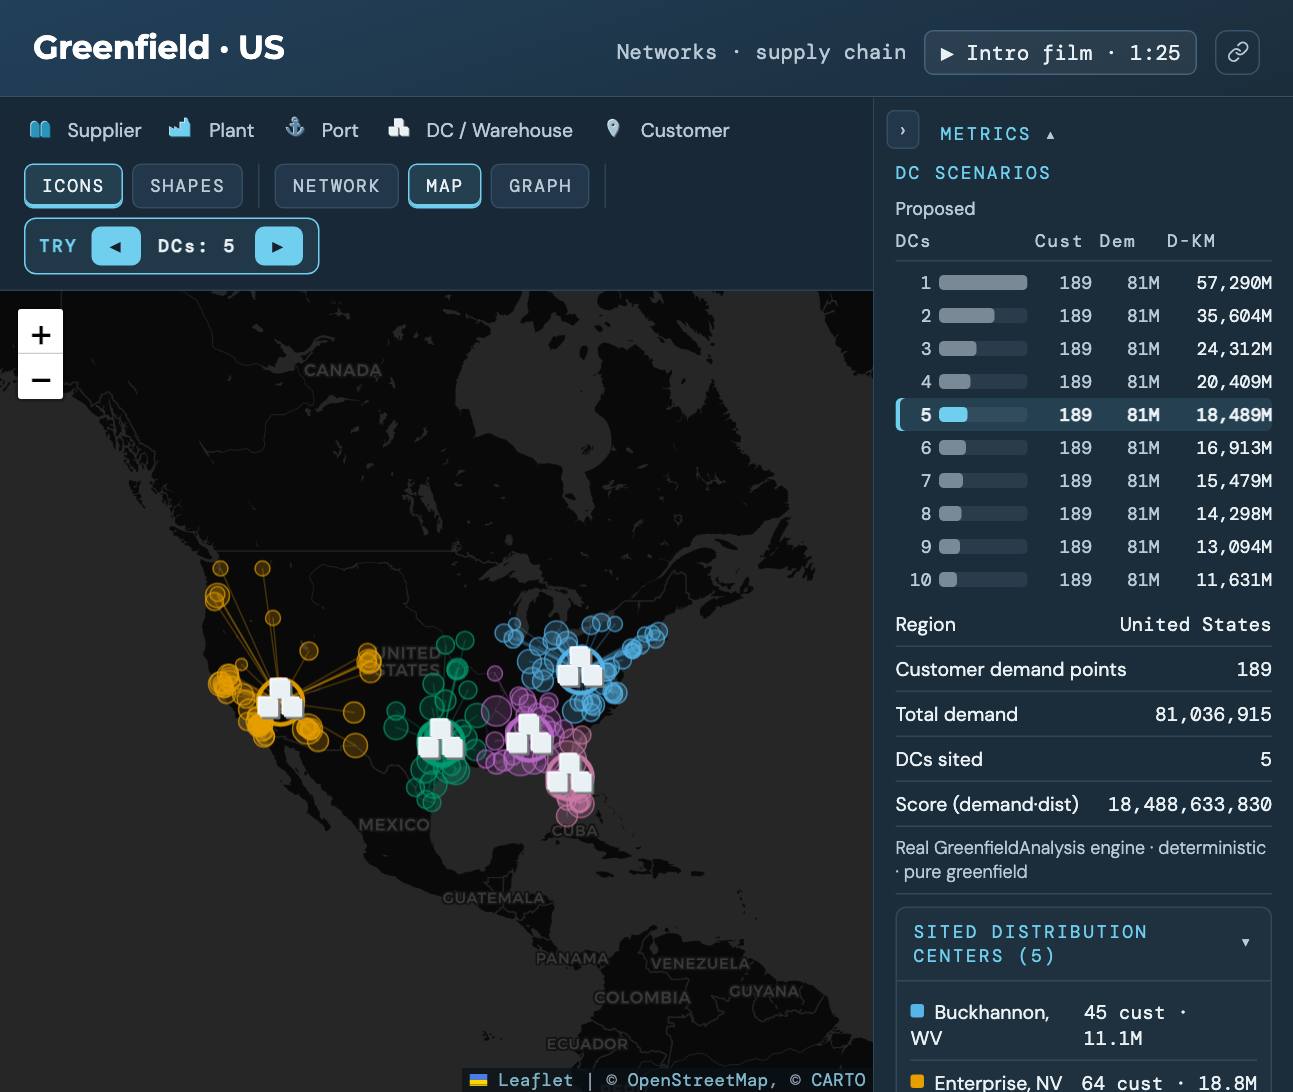
189 US customer demand points and no existing sites. A greenfield engine places two to eight DCs from scratch, and you step the count to see where one more stops paying.
The question it answers
If you threw out today’s footprint, where would you put the DCs? Greenfield siting ignores existing buildings and places facilities where demand clusters, weighted by how much each customer buys. It uses demand times distance as a stand-in for cost, which makes it a fast first answer rather than a final one.
What you’ll see
The sited DCs on a map, each with its customers colored to match. The results column lists every DC count with its demand-distance score, and GRAPH plots that score against the number of DCs. The curve falls steeply at first and then flattens. The demo marks the elbow, where each added DC starts buying much less.
What to change
- Step the DC count with the arrows above the map and watch the clusters split.
- Open GRAPH to see the score curve and the elbow.
- Ask the assistant why the clusters fall where they do.
The siting comes from the GreenfieldAnalysis engine and is saved, so the same count always gives the same answer.
Where it leads
How many distribution centers do you need? reads this curve in detail. If you already have DCs, the question changes to which ones to keep. That’s Brownfield · EU.
Run Greenfield · US
It opens in the Sandbox with sample data. No signup, no install.
Run it →Or see all eleven network demos.