How Many Distribution Centers Do You Need?
Weigh Distance Against Fixed Cost and Inventory
Every added DC puts stock closer to customers. It also adds a building, a crew and another pile of inventory. The right number is where the next DC stops paying for itself, and finding it takes more than one kind of analysis.
What changes when you add a DC
More DCs shorten the trip to customers, so outbound freight falls and deliveries get faster. But each DC carries fixed costs for the lease, the staff and the systems. Inbound freight rises because full trucks from the plant get split across more destinations. Total inventory rises too, because every site needs its own buffer. The best count balances the falling curve against the rising ones.
Outbound distance falls fast, then flattens
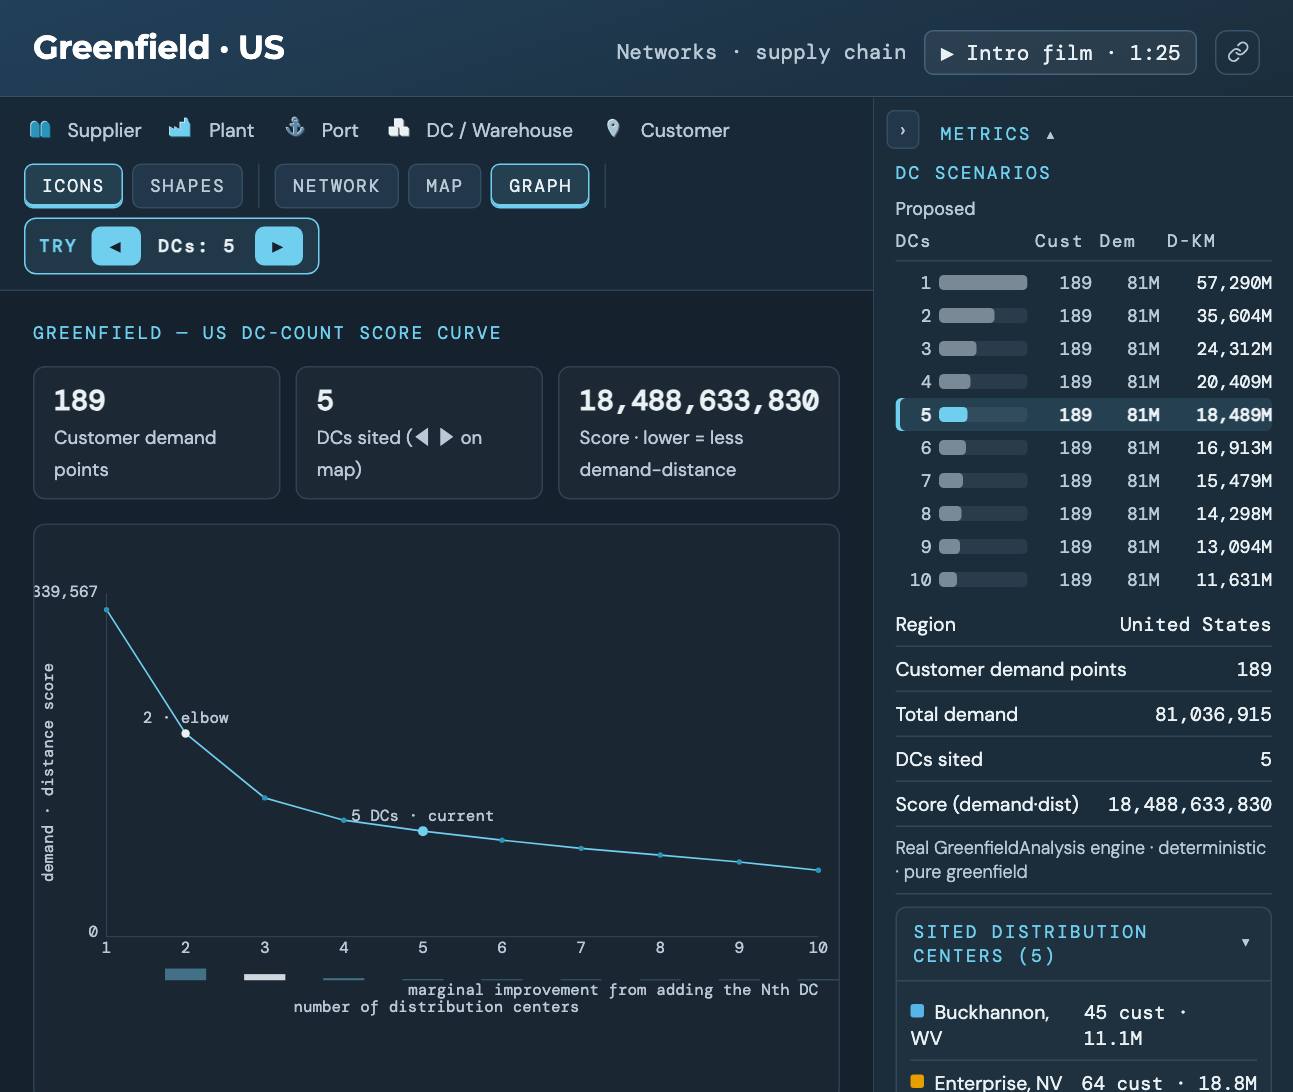
The first few DCs do most of the work. Going from one DC to two cuts the distance to a national customer base sharply, because half the country is suddenly much closer. Going from nine to ten moves a few customers a little closer. Plot the demand-weighted distance against the number of DCs and you get a curve that drops steeply and then levels off. The bend is called the elbow.
In the Greenfield · US demo, on 189 US demand points, going from one DC to two cuts the demand-distance score by about 38%. Going from four to five cuts it by about 9%. The demo marks its elbow at two DCs. Past the elbow each DC still helps, just by less, so the elbow is where the argument about cost starts rather than where it ends.
The inventory penalty of more DCs
This is the cost that distance-based siting doesn’t see. Each DC has to cover the demand swings of its own customers. When one DC serves the whole country, a slow week in the West and a busy week in the East partly cancel out. Split the same demand across several DCs and each one faces its own swings alone, so each needs its own safety stock.
A common rule of thumb, the square root law (Maister, 1976), says total safety stock grows with the square root of the number of stocking locations. Under its assumptions, going from one DC to four roughly doubles the safety stock needed for the same service. The assumptions matter. They include demand split evenly, independent from region to region, and the same lead time and service target everywhere. Real networks break most of them, which is why the number is a warning rather than an answer.
Cycle stock matters as well. More DCs usually means smaller, more frequent replenishments to each, and that changes inbound freight and handling as much as it changes stock.
Add the costs a distance curve leaves out
A distance curve alone will always say more DCs are better. To find where they stop paying, put costs on it:
- fixed cost per DC, including lease, labor and systems;
- outbound freight by lane, with real rates rather than distance;
- inbound freight from plants or ports to each DC;
- inventory carrying cost at each site, including the safety stock each one needs;
- any service rule you have to meet, such as next-day delivery to a share of customers.
With those in the model, the question becomes a facility-selection optimization. It weighs every cost together and picks a count and a set of sites. Supply chain optimization vs simulation covers how that works.
If you already have DCs
Most companies aren’t starting from scratch. The practical question is usually “could we run with fewer?” That’s footprint rationalization, where the engine chooses which existing DCs to keep. The Footprint rationalization demo opens on sixteen DCs and lets you step down from there. Greenfield, brownfield and footprint explains how the questions differ.
Test the count before you commit
An optimizer picks a count from averages. It can’t show how stock behaves when demand swings week to week, or whether a DC runs short while it waits for the plant. Before you sign leases, run the chosen network through a year of realistic demand in a simulation and watch stock at each site. If a smaller count looks fine on average but runs short at peak, the simulation will show it. How to know your supply chain model is right covers making that run trustworthy.
Step the count yourself
Open Greenfield · US, step the DC count with the arrows above the map, and open GRAPH to see where the curve bends. The center of gravity guide explains the siting method behind each count.
Find the elbow on a US network
Greenfield · US sites two to eight DCs from 189 demand points and plots the score at every count.
Open the score curve →