Forecasting New-Vehicle Flow Across a Continental Network
A Network Model That Starts From Where Every Vehicle Actually Is
A vehicle-logistics company, part of a major railroad, runs a major automaker’s new-vehicle shipments from assembly plants to dealers across a continent. Its job is to cut order-to-delivery time, and its carriers and ramps need to know what is coming and when. A model that starts empty takes weeks to settle, which is most of a two-week forecast. The network model, built with Simulation Dynamics, starts each run from the tracked location of every vehicle, railcar and truck, and settles within a day or two. By the company’s own figures, one set of recommendations from it saved $21.7M in inventory carrying costs and cut transit time by 19%. The company runs it every week for more than ten years.
- The business
- A railroad-owned vehicle-logistics company running a major automaker’s new-vehicle distribution · ~16 plants, 78+ rail facilities, 10 ports, ~3,500 dealers
- The question
- What’s coming at each ramp and carrier over the next few weeks, and which network changes pay off?
- The model
- Plants, ramps, railcars, trucks, parking and holds, started from that day’s vehicle records
- What it’s worth
- $21.7M in carrying costs and 19% less transit time (the company’s figures); weekly use for 10+ years
- Source
- Winter Simulation Conference paper · the company’s own figures · SDI project record
What the company is up against
According to the published paper, the network has about 16 assembly plants, 18 rail loading facilities, more than 60 rail unloading facilities, 10 ports and roughly 3,500 dealers. The dealers are grouped into about 60 dealer service areas. Around 2.5 million vehicles a year move through it, and at any moment more than 100,000 are somewhere between a plant and a dealer. Our project record puts the goal as cutting the number of vehicles in the network by 20%.
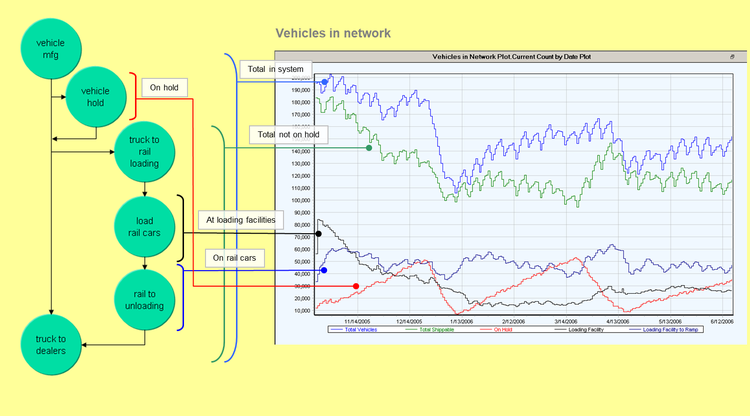
Each vehicle rolls off the line and waits near the plant. Dealers within a couple of hundred miles are served by truck. Everything else goes to a rail loading ramp, waits for a railcar it physically fits on, and can cross more than one railroad before reaching a destination ramp. There it is unloaded, parked, and loaded onto a haulaway truck for the dealer.
Four things limit how fast vehicles move:
- Transport pools. Haulaway trucks and railcars come from carrier pools sized once a year across the whole industry. They are ordered as production and empty return times demand.
- Parking. When spaces run out at a plant or loading ramp, vehicles go to temporary remote lots. When a destination ramp is full, unloading stops, and the rail network backs up behind it.
- Loading rules. Railcar types, vehicle heights, route clearances, shifts and holiday calendars all set how fast vehicles can be loaded.
- Holds. Model-year rollouts, promotions, quality holds and planned shutdowns hold vehicles back and then release them, sometimes all at once.
Production pushes vehicles into the network, and trucks and railcars are pulled in to move them. With that mix of push and pull, a spreadsheet of average transit times can’t show where the network will jam.
Why a model that starts empty can’t forecast two weeks out
The company plans on two horizons. Strategic planning looks three to twelve months out: promotions, inventory built ahead of a launch, closing or moving a rail facility. Tactical planning looks one to four weeks out. It answers the questions carriers and facility operators actually ask, which the paper quotes as “What’s coming at me?” and “When will it get here?”
A simulation that starts empty is fine for the first kind of question and poor at the second. It spends its first weeks filling up, and during that time resources sit idle and vehicles move unrealistically fast. For a two-week forecast, that warm-up period is most of the forecast.
How it’s modeled
The company and SDI build the model in SDI’s Supply Chain Builder. Production comes from the automaker’s weekly plan, turned into daily output at each plant. Dealer demand comes from historical patterns and marketing assessments. Routes live in the model’s database, so a route change doesn’t mean changing the model. Parking, railcar spots, truck and railcar pools, loading rules and holds are all modeled as the constraints they are.
For tactical runs, the model starts warm. The company’s vehicle-tracking system follows every vehicle from planned production to dealer delivery, updated by EDI messages from every carrier and facility. A utility pulls every open vehicle record from it, usually set to run each day just before the business day starts. The model then places each vehicle where it really is: in a plant lot, at a ramp, or on a specific railcar or truck in transit.
The live data is never clean. Late or missing EDI reports leave gaps. Some vehicles left the plant long ago but are still undelivered. Some railcars are due at their next stop before the extract is even taken. Some vehicles are on routes that don’t exist because weather forced a detour. The import step checks each record for a believable current state, a believable next event and a known last-event time, estimates what it can, and reports the rest. The paper calls this grooming the data, and calls the import’s robustness crucial given the millions of records it handles.
What the model shows
Started empty, the model takes weeks to fill the network, and average transit time creeps up for the first week or so because resources are free and nothing is congested. Started from the tracking data, the network begins near its normal inventory and transit time begins near its long-run level. The paper puts the remaining start-up effect at one to two days for most measures, once the three days used to fill the plant pipelines are set aside.
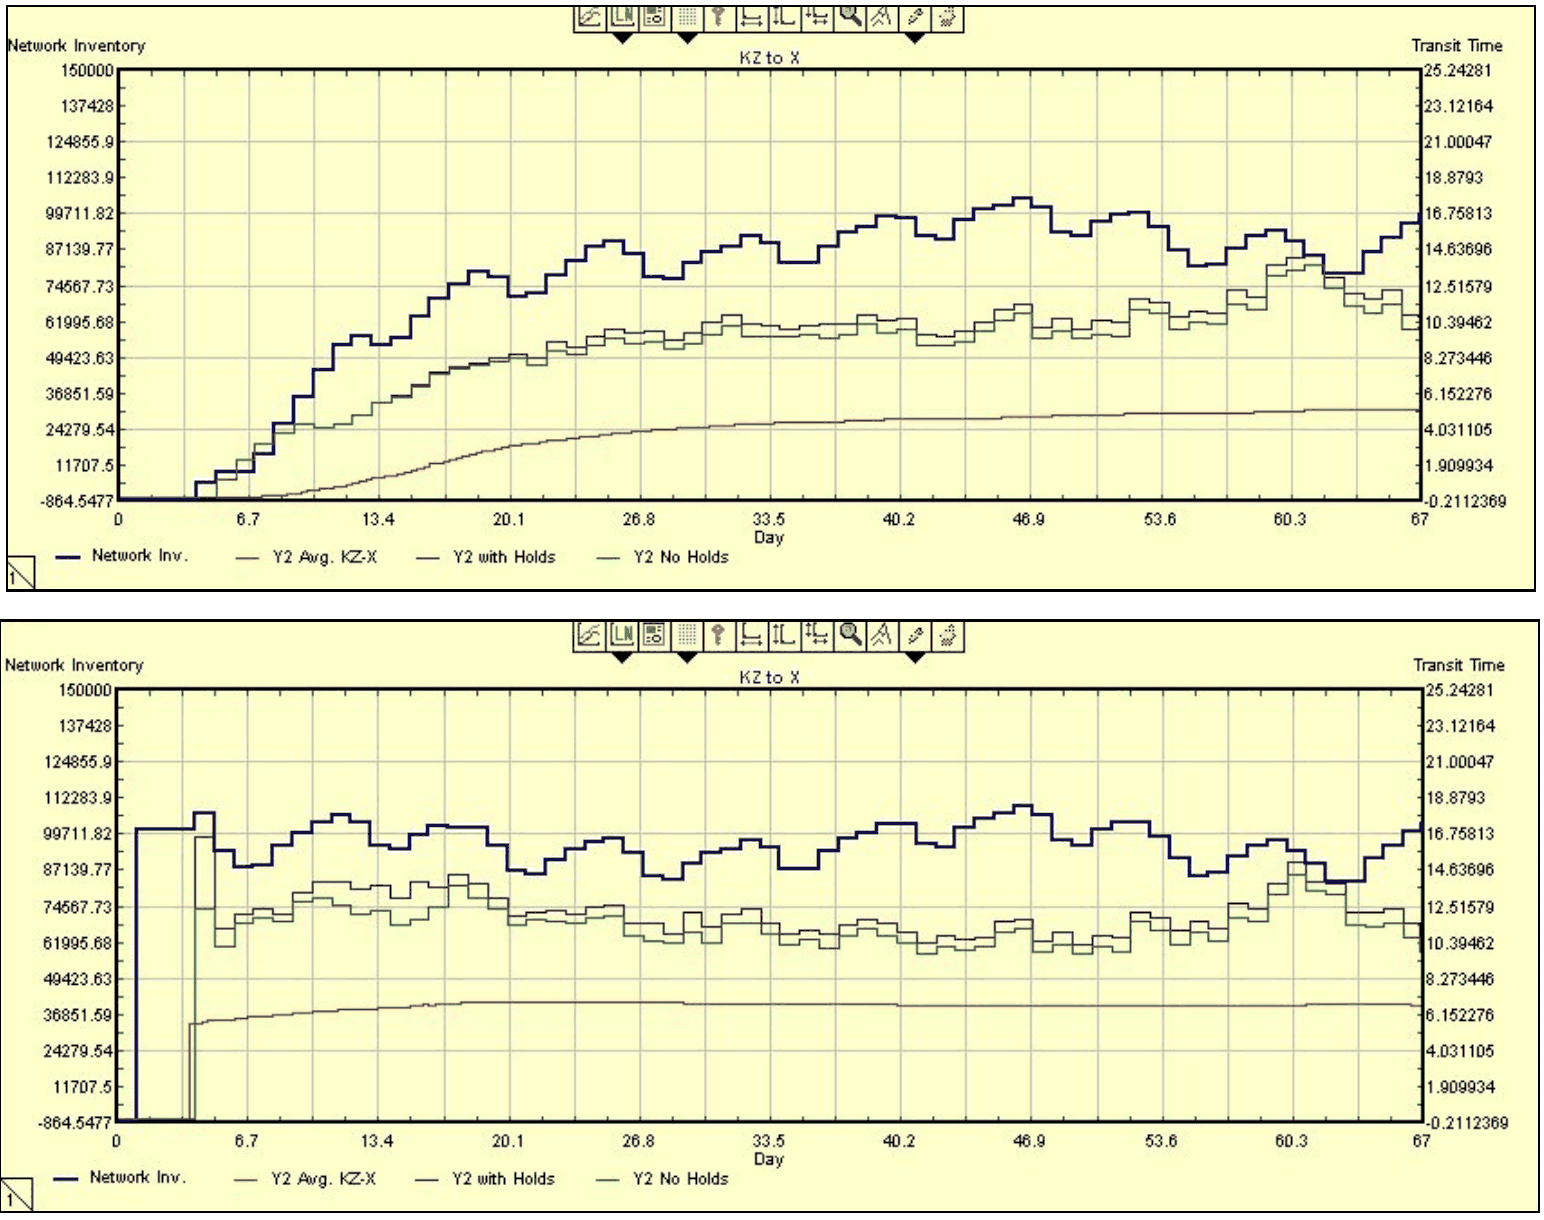
The paper says the warm start allows a more accurate short-term analysis. Each run reports bottlenecks as they emerge, daily throughput at every plant lot, loading ramp and destination ramp, transit time by route segment, and where every truck and railcar is. It also gives a daily picture of where vehicles sit in the pipeline, so surges show up before they arrive.
The paper’s conclusion points past the model to the data feeding it. It says faster event reporting into the tracking system would have a significant impact on how accurate the projections can be.
How the company uses it
Our project record adds what the paper doesn’t cover:
- Every week, analysts run a two-week forecast of vehicles arriving at each rail unloading facility, and use it to plan staff shifts there.
- Every year, the company’s CFO runs the model to set the budget for network resources from projected vehicle production.
- In a crisis, when a major hurricane disrupts the network, the team uses the model to reroute vehicles and estimate how long recovery will take.
- For speed, SDI rebuilds the model as a standalone application. That cuts a run from six hours to about twenty minutes, fast enough for scenario work during the hurricane response.
What it’s worth
“[We] leveraged VINLogic to recommend solutions that saved $21.7M in inventory carrying costs and reduced transit time by 19%.”Manager, Network Analysis & Engineering, the vehicle-logistics company
That figure is the company’s, and it comes from one set of recommendations. Savings from the weekly use that follows come on top of it.
“VinLogic is at the heart of what we do. Our analysts run it every week. I run the model to more accurately predict our annual budget! The reason we never call you is because the model just works.”CFO, the vehicle-logistics company
Where this sits in ReliaSim
This model’s limits are finite resources that move product (trucks, railcars, parking, loading crews) and shipping and receiving that take time. In ReliaSim’s supply chain simulation, sites and routes are kept in tables, the same way. ReliaSim models are built from a company’s own records and aren’t started from a live feed the way this one is. The network half of the story, which sites to keep and where demand should be served from, runs in the browser on a sample distribution network.
Where this work comes from
Built by the company’s team and Simulation Dynamics (the team behind ReliaSim), first in SDI’s Supply Chain Builder on a commercial simulation platform, then as a standalone application · the network, the model design and the start-up comparison come from the paper Initializing a Distribution Supply Chain Simulation with Live Data, Winter Simulation Conference · the savings and transit figures are the company’s own · later use comes from our project record.
A free line assessment, this fall
Bring one question about your line. We model it on your own data and send back a two-page readout in about five business days.
Apply for a free line assessment →Or explore the Sandbox first, with no sign-up.