Pack at the Plant, or Pack at the DC?
Where Packaging and Cycle Stock Belong in a Consumer Goods Network
A US consumer goods manufacturer made bulk product on cycles as long as 91 days and packed it at the plant, so every run became weeks of finished goods allocated on a forecast. Moving packing downstream to the distribution centers looked like the fix. A model of the whole network showed it was the right answer for some product categories and the wrong one for others, and it showed which were which.
- Sector
- Consumer goods
- The decisions
- Where to pack, and where to hold cycle stock
- Scope
- Plants, distribution centers and customer-facing inventory
- What it was worth
- A category-by-category policy instead of a network-wide guess
- Evidence
- Project record, original model output
Long production cycles, packed too early
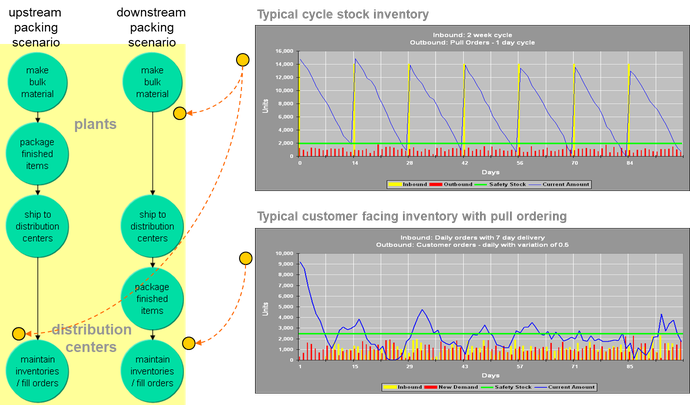
The bulk material was made at the plants on cycles of 7, 14, 28 or as many as 91 days. Each production run was immediately allocated to packaging runs of finished items. Packing at the plant turned every long run into a large block of finished-goods cycle stock, and the forecast decided which item and which distribution center each case went to.
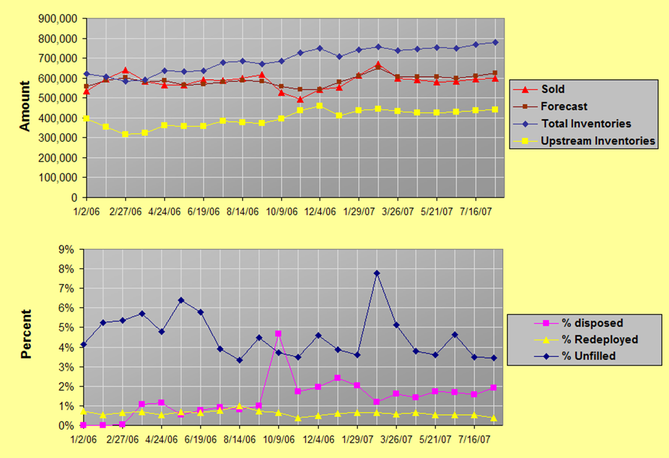
When the forecast was wrong, the cost showed up twice. Bulk was packed into the wrong items, and finished goods were shipped to the wrong distribution centers and had to be redeployed between them. Stock that waited too long aged out and was thrown away.
Two questions from the same network
The work answered two related questions, each with its own model built on the same inputs: historical forecast and demand, and production rates by system and product.
| Question | Alternatives | Experiment factors |
|---|---|---|
| Where should packing happen? | Pack at the plant, or ship bulk to the distribution centers and pack there weekly against next week’s local forecast | Reorder policy; which product categories to pack downstream |
| Where should cycle stock sit? | Push each run out to the distribution centers, or hold it at the plant until a distribution center reorders | Reorder policy; which product categories to push downstream |
Both models were scored the same way: total inventory, finished-goods inventory, bulk inventory, customer order fill rate, redeployment cost and disposal cost for aged product.
What packing downstream traded
Packing weekly at the distribution center, against that location’s own forecast for the next week, almost eliminated finished-goods cycle stock. It also ended redeployment of finished product from one distribution center to another. Customer service held.
The price was a new kind of inventory. Bulk material now had to sit at the plants until it was pulled, and again at each distribution center until it was packed.
| Pack at the plant | Pack at the distribution center | |
|---|---|---|
| Gains | No bulk inventory anywhere; it becomes finished items as it is made | Finished items packed weekly close to demand, which limits the damage from forecast error. No redeployment between distribution centers. |
| Costs | Bulk allocated to items on a forecast, and items allocated to distribution centers on a forecast. Misallocation means redeployment. | Bulk inventory at plants and at every distribution center, which can raise total inventory cost |
For many product categories, the new bulk inventory canceled out the gains. For others it did not. Because the model ran item by item, the answer was not “pack downstream” or “don’t”. It was a list of categories worth moving, and the rest left where they were.
Where cycle stock should sit
The second model asked a related question: with long production cycles, should each run be pushed out to the distribution centers, or held at the plant and released only when a distribution center reorders?
Pushing cycle stock downstream looks protective, because it tops up safety stock at the locations facing customers. The model showed the other side. When a run was misallocated, some distribution centers ran out early while others still held plenty, and moving stock between them was not always feasible. The shortage then triggered the next production run early, which is what long cycles exist to avoid.
| Hold cycle stock at the plant | Push cycle stock downstream | |
|---|---|---|
| Gains | Less redeployment for high-variability products; fewer early production triggers | Cycle stock at the distribution center protects its safety stock |
| Costs | Safety stock at the distribution centers gets no help from cycle stock | Misallocation leads to redeployment and early production triggers |
The conclusion was to keep cycle stock upstream at the plants and fill the distribution centers on a pull basis. The same held for the bulk material shipped downstream in the packing scenarios.
Two findings that carry over
A textbook safety stock formula, adjusted, was accurate
A packing schedule fixed to once a week changes how much safety stock a location needs. The standard safety stock calculation, modified for that weekly schedule, predicted the model’s safety stock requirements at the customer-facing inventories accurately. That is a useful result on its own: the simulation confirmed a formula the planners could keep using without the model.
Capacity shortfalls had a defined order of response
When a plant could not keep up with demand, the first response was to move that demand to another, less efficient plant. Only when capacity fell short across the whole system did the model schedule prebuilds.
Where this sits in ReliaSim
The question joins the plant and the network. Production run length is a plant decision, and redeployment, fill rate and disposal are network outcomes, so a model that holds only one side cannot answer it. That combination is what ReliaSim’s supply chain modeling is built for: production runs at the plant feeding demand, inventory and ordering across the network, in one model.
The simplest version of the question, where to hold safety stock across a multi-tier network, runs in the browser today.
On attribution. These models were built in the mid-2000s by Simulation Dynamics, the team behind ReliaSim, using its Supply Chain Builder library on a commercial simulation platform. This account rests on our project record rather than a published paper, and the client is not named. The software in the sandbox did not produce these results.