How to Tell If Your Simulation Is Right
Before You Trust a Model, See It Match Your Line
Most simulation models are never checked against the plant. ReliaSim® fits your stop data and shows you how closely the model matches your line before you test a single change. This guide explains what that check involves and how to read the result.
Models built from assumptions
A line model needs to know how often each machine stops and how long each stop lasts. When nobody has the stop records to hand, those numbers come from somewhere else: nameplate speeds, a planner’s estimate, one downtime average for a whole machine. The model runs either way. It reports throughput, OEE and a bottleneck, the figures look reasonable, and because they look reasonable nobody compares them with what the line actually did.
The gap shows up when you start testing changes. Every scenario is a change to a base case. If the base case doesn’t behave like your line, each scenario carries the same error, and the difference between two wrong answers can still look sensible. A model that has never been compared with the plant gives you numbers, but it can’t tell you whether they are right.
What checking a model looks like
The check is easy to describe. Run the model over a period the line has already been through, with the same products and schedule, and compare its output with what was measured. If the two agree, you have a base case you can test changes on. If they don’t, you’ve found a problem in the data or the model before anyone builds a decision on it.
The comparison has to go below the line total. A model can match annual OEE while overstating one machine’s stops and understating another’s, so the errors cancel. That model gives the wrong answer as soon as you ask what fixing one of those machines is worth. So the check looks at each failure mode on its own as well as the total.
| Compare | A gap here can point to |
|---|---|
| Line output or OEE over the period | A stop type missing from the model, or a schedule that differs from the one the line ran |
| Availability for each failure mode | Stops logged under the wrong cause, or a failure mode with too few events to describe well |
| Starved and blocked time for each machine | Buffer sizes or conveyor speeds that don’t match the floor (why these two figures matter) |
| Stop counts and durations | Short stops left out of the records, or long repairs split into several entries |
Reading the validation plot
ReliaSim’s built-in plot covers the per-failure-mode part of that comparison. Each marker is one failure mode on one machine, placed by its availability in the model against its availability in your line’s own stop data.
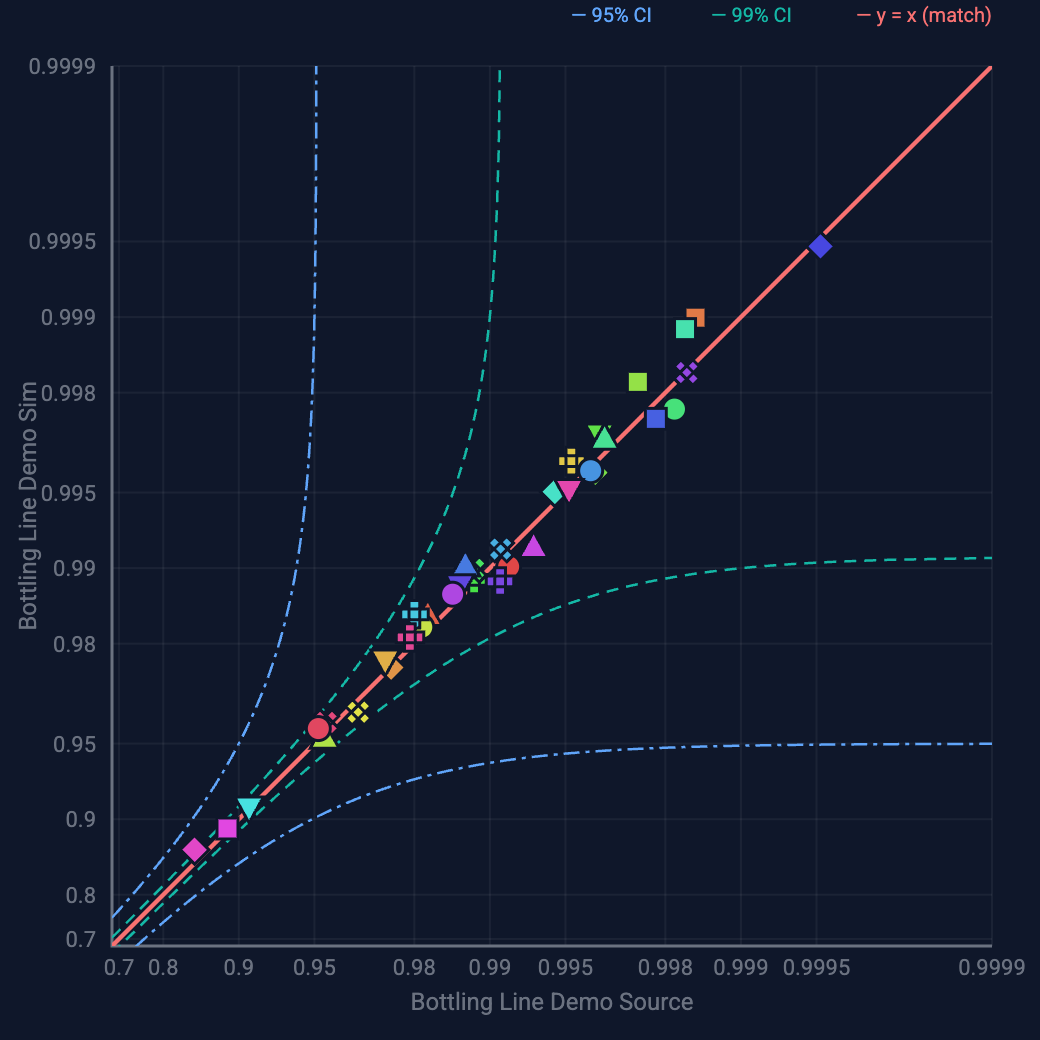
- The horizontal axis is the availability for that failure mode in the line’s own event history, meaning the share of time it didn’t have the machine down.
- The vertical axis is the same figure from the model, run over the same span.
- The diagonal is the line y = x. A marker on it means the model and the plant agree for that failure mode.
- The scale is in nines. 0.9, 0.99 and 0.999 sit evenly apart, and each step is ten times less downtime than the one before. A failure mode that costs a tenth of a percent gets as much room as one that costs ten percent. On an ordinary scale the small ones would pile into one corner.
- The bands are the two pairs of curves either side of the diagonal, set at 95% and 99%. A marker inside them matches history within the spread you’d expect. A marker outside them shows where to look.
A good plot has its markers along the diagonal from top to bottom with few or none outside the bands. When most markers sit above the diagonal, the model is losing less time than the line did; when most sit below, it’s losing more. A lean to one side is worth chasing before any single marker, because it usually means something is missing from the model.
How ReliaSim builds the check into the work
In ReliaSim the check is a normal step in building a model, so it doesn’t need a separate project. The work runs in this order.
- Fit your stop data. ReliaSim reads the line’s stop records and fits a run-time and a repair-time distribution to each failure mode, so a jam and a changeover never share an average. For a closer look at the shapes, ReliaStats® fits and ranks a wider set of distribution types and exports the result to ReliaSim.
- Build the line. Lay out the machines, their rates, the buffers between them and the way product moves through, as the line actually runs.
- Compare the model with measured history. Run the model over a period you have measured. ReliaSim plots each failure mode’s availability in the model against what your line’s own data measured, with 95% and 99% bands, so you can see where the model matches your line before you trust what it shows.
- Then test changes. Once the base case matches, ask what would happen if you added a buffer, sped up a machine or fixed a failure mode. Each scenario is a change to a model you have already seen match your line.
The ReliaSim method and how a project runs cover the same steps in more detail.
The published check
The approach has been tested in public. Fischel and Lange modeled a multi-line food plant and published the work at the 2020 Winter Simulation Conference. That model was rebuilt in ReliaSim and independently validated by Tom Lange, a co-author of the paper, and it came within 1% of the plant’s measured OEE. The published OEE validation case study has the details.
If you’re weighing a model someone else built, how to check a digital twin’s accuracy claim lists the questions to ask. How to know your supply chain model is right applies the same idea to a distribution network.
Try a line model in the Sandbox
The Sandbox runs the bottling-line models in your browser with no sign-up, next to the ReliaStats tools for stop data.
Try the Sandbox → Free line assessment