“What’s Coming at Me, and When Will It Get Here?”
Simulating a 2.5-Million-Vehicle Network From Where Every Vehicle Actually Was
Insight Network Logistics, a Union Pacific subsidiary, managed DaimlerChrysler’s new-vehicle distribution from assembly plants to dealers across North America. VinLogic, a model built with Simulation Dynamics, started each run from the live location of every vehicle, railcar and truck. One set of recommendations from it saved $21.7M in inventory carrying costs and cut transit time by 19%, and the model stayed in weekly use for more than ten years.
- Sector
- Automotive logistics
- The decisions
- Resources, routes and vehicle holds across rail and truck
- Scope
- ~16 plants, 78+ rail facilities, 10 ports, ~3,500 dealers
- What it was worth
- $21.7M in carrying costs; transit time down 19%
- Evidence
- WSC 2003 paper; results quoted by INL
The network
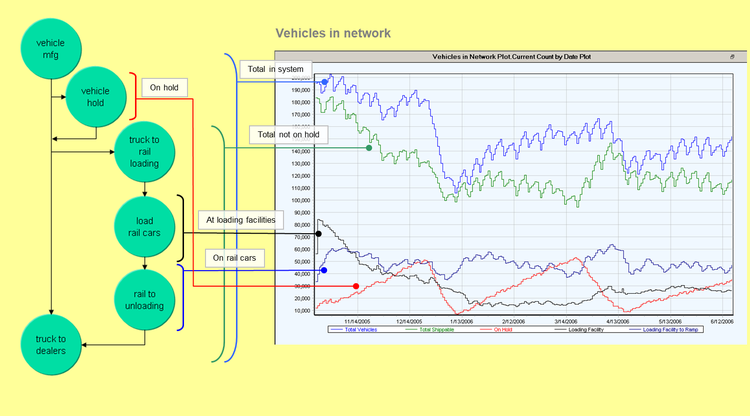
According to the published paper, the network had about 16 assembly plants, 18 rail loading facilities, more than 60 rail unloading facilities, 10 ports and roughly 3,500 dealers, grouped into about 60 dealer service areas. Around 2.5 million vehicles a year moved through it, and at any moment more than 100,000 were somewhere between a plant and a dealer.
Each vehicle rolled off the line and waited near the plant. Dealers within a couple of hundred miles were served by truck. Everything else went to a rail loading ramp, waited for a railcar it physically fit on, and could cross more than one railroad before reaching a destination ramp. There it was unloaded, parked, and loaded onto a haulaway truck for the dealer.
What actually limited the flow
- Transport pools. Haulaway trucks and railcars came from carrier pools sized once a year across the whole industry, and were ordered as production and empty return times demanded.
- Parking. When spaces ran out at a plant or loading ramp, vehicles went to temporary remote lots. When a destination ramp was full, unloading stopped, and the rail network backed up behind it.
- Loading rules. Railcar types, vehicle heights, route clearances, shifts and holiday calendars all set how fast vehicles could move.
- Holds. Model-year rollouts, promotions, quality holds and planned shutdowns held vehicles back and then released them, sometimes all at once.
Vehicles were pushed into the network by production; trucks and railcars were pulled in to move them. That combination, one push and one pull, is why a spreadsheet of average transit times could not predict where the network would jam.
Starting from today, not from empty
INL planned on two horizons. Strategic planning looked three to twelve months out: promotions, inventory built ahead of a launch, closing or moving a rail facility. Tactical planning looked one to four weeks out, and answered the questions carriers and ramp operators actually asked: what’s coming at me, and when will it get here?
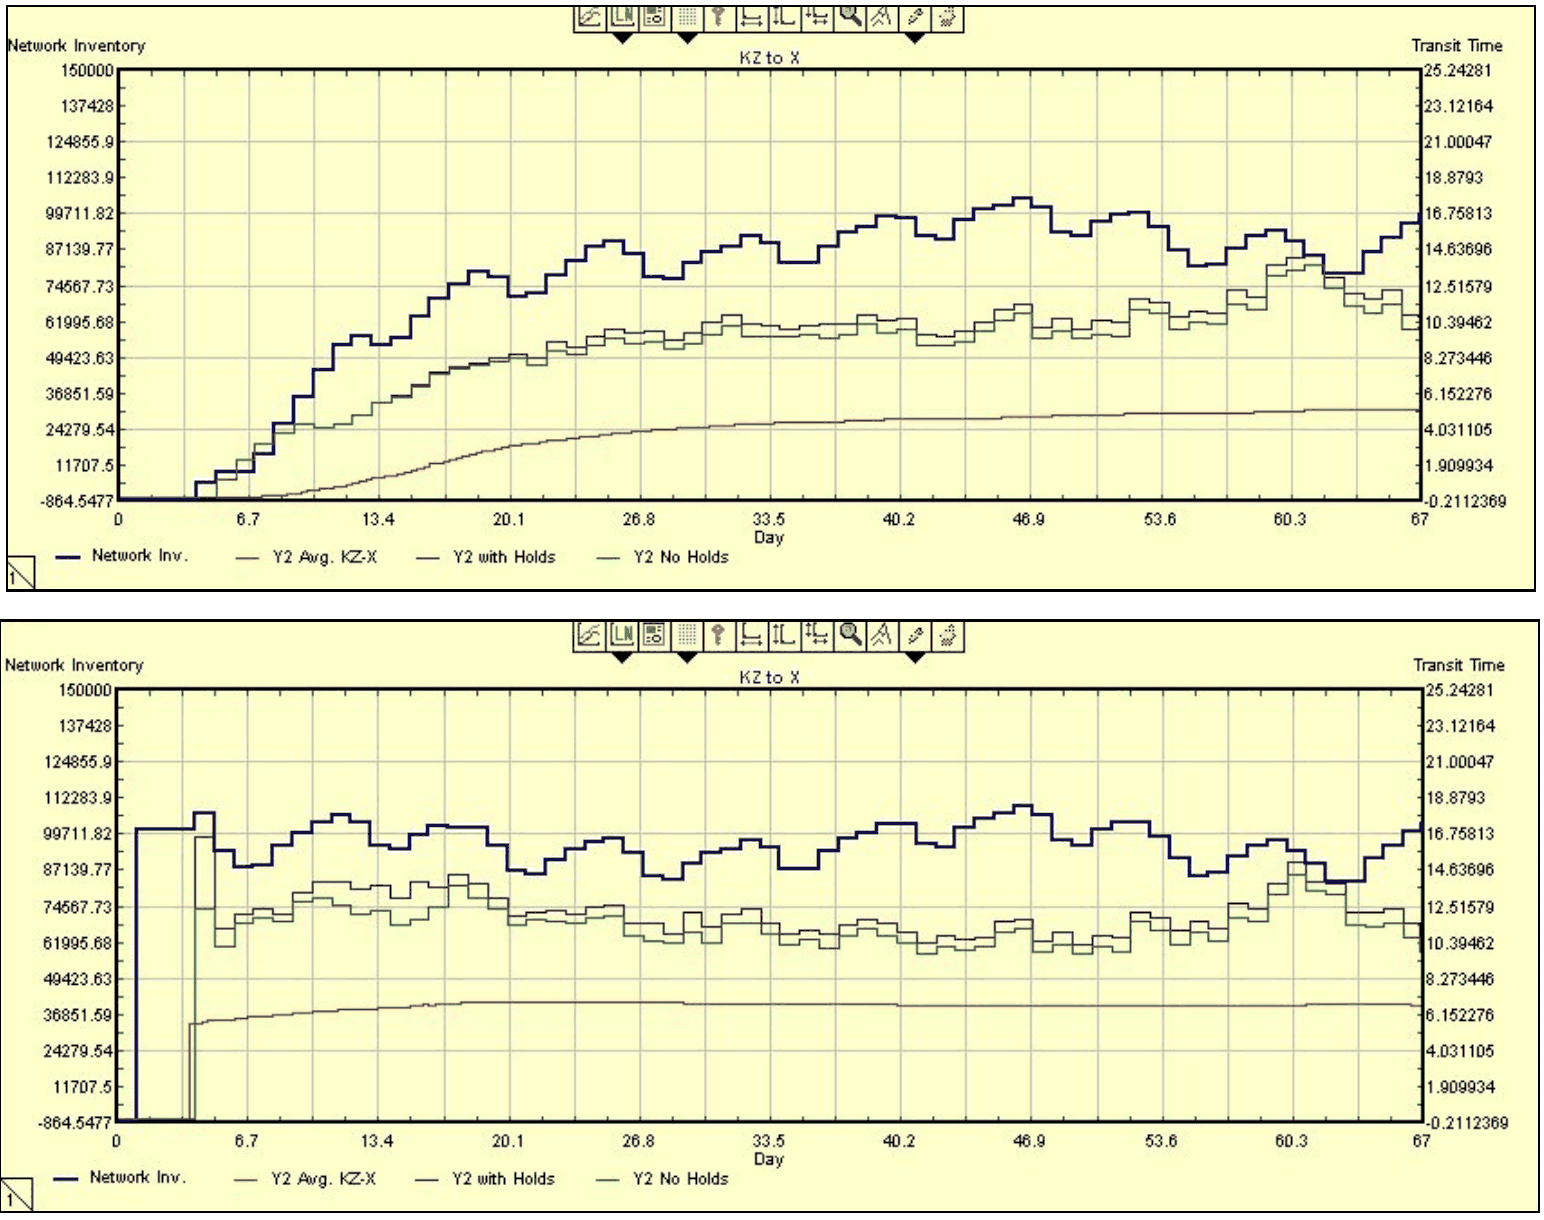
A simulation that starts empty is fine for the first kind of question and poor at the second. It spends its first weeks filling up, and during that time resources are idle and vehicles move unrealistically fast. For a two-week forecast, that warm-up period is most of the forecast.
VinLogic solved this by starting warm. INL’s VinVision system tracked every vehicle from planned production to dealer delivery, updated by EDI messages from every carrier and facility. Each morning, before the business day, a utility pulled every open vehicle record, and the model placed each vehicle where it really was: in a plant lot, at a ramp, or on a specific railcar or truck in transit.
The live data was never clean. Late or missing EDI reports produced vehicles that had left the plant long ago but were still undelivered, railcars due at their next stop before the extract was even taken, and vehicles on routes that did not exist because weather had forced a detour. The import step checked each record for a believable current state, a believable next event and a known last-event time, estimated what it could, and reported the rest. The paper calls this grooming the data, and it was as important as the model itself.
How it was used
Our project record adds what happened after the paper:
- Every week, analysts ran a two-week forecast of vehicles arriving at each rail unloading facility, and used it to plan staff shifts there.
- Every year, INL’s CFO ran the model to set the budget for network resources from projected vehicle production.
- In a crisis, after Hurricane Katrina disrupted the network, the team used the model to test reroutings and estimate how long recovery would take.
- For speed, SDI later rebuilt VinLogic as a standalone application, cutting a run from six hours to about twenty minutes, fast enough for scenario work on the day it was needed.
What it was worth
Reported by INL
“[We] leveraged VINLogic to recommend solutions that saved $21.7M in inventory carrying costs and reduced transit time by 19%.”Manager, Network Analysis & Engineering, Insight Network Logistics
That figure comes from one set of recommendations. The model kept informing decisions every week for more than a decade afterward, and those later savings came on top of it. We have no sourced total for them, so none is claimed here.
“VinLogic is at the heart of what we do. Our analysts run it every week. I run the model to more accurately predict our annual budget! The reason we never call you is because the model just works.”CFO, Insight Network Logistics
Where this sits in ReliaSim
What limited VinLogic’s network was not its map. It was trucks, railcars, parking and loading crews: finite resources that move product, and shipping and receiving treated as real activities that take time. Those are what ReliaSim’s Supply Chain tier is being built to add on top of network demand, inventory and ordering. Its sites and routes are designed to live in tables rather than be drawn, so a route change is a data change and not a rebuild, which is how VinLogic worked too.
The network half of the story, which sites to keep and where demand should be served from, runs in the browser today on a North American distribution network.
On attribution. VinLogic was designed and built by the INL and Simulation Dynamics team, the team behind ReliaSim, first in SDI’s Supply Chain Builder on a commercial simulation platform and later as a standalone application. The network description and the start-up comparison come from the published paper: Dalal, Bell, Denzien and Keller, Initializing a Distribution Supply Chain Simulation with Live Data, Winter Simulation Conference 2003. The savings and transit-time figures are INL’s own, and the account of later use rests on our project record. The software in the sandbox did not produce these results.